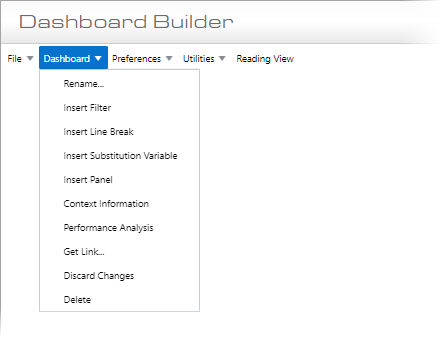
Dashboard drop-down menu
Rename
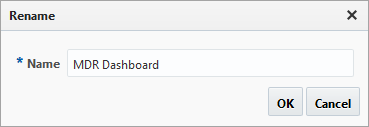
Use the Rename pop-up window to rename the dashboard.
Insert Filter (Page Filter)
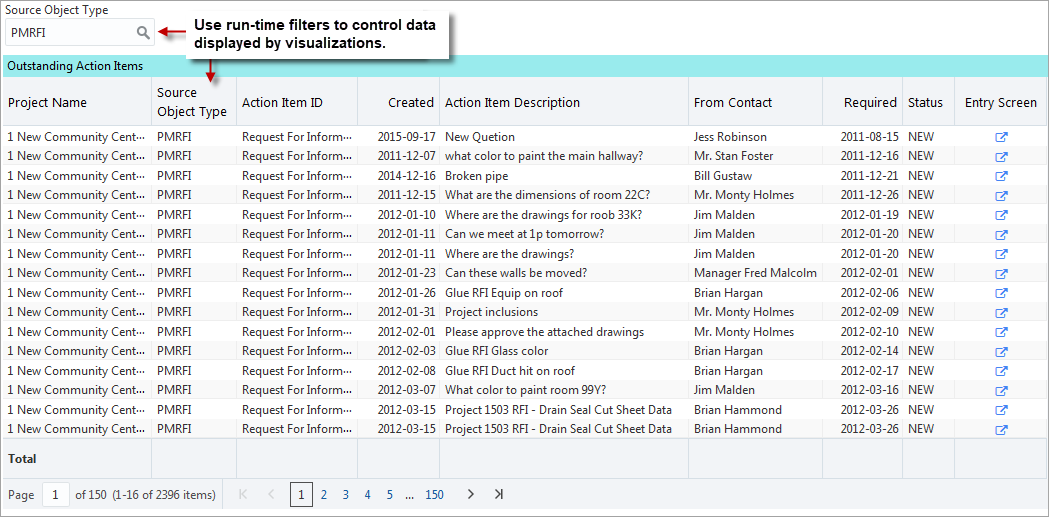
This option is available if the screen is in Edit Mode. It is used to add a page filter to a dashboard to dynamically control the data displayed by one or more of the dashboard’s visualizations during runtime.
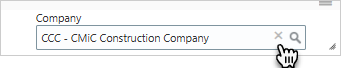
To clear a page filter's selected item, hover over the populated filter and a Clear Filter icon ( ) will appear. Click the icon, and the filter will be instantly cleared.
Adding & Configuring Page Filter
To add a page filter, select the “Insert Filter” option in the Dashboard drop-down menu, which creates a page filter at the top of the canvas if it is the first one added, or next to the previously added filter otherwise.
Next, drag and drop the filter over the visualization that is in the desired position for it, which causes that visualization to be moved to the right. If required, force a new line after the filter using the “Insert Line Break” option, which positions the new filter over the visualization forced to the new line.
Add Field to Filter Against From Data Source to Fields Pane
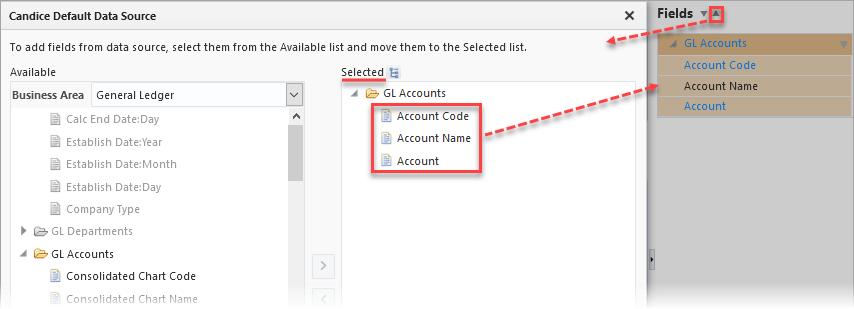
With the new filter selected by clicking its colored header, click the up-arrow ( ) in the Fields pane to add the field to filter against from a selected data source to the Fields pane. For details about adding fields from a data source to the Fields pane, please refer to the following
Plotting Fields – Tab: Add Field to Filter Against From Fields Pane
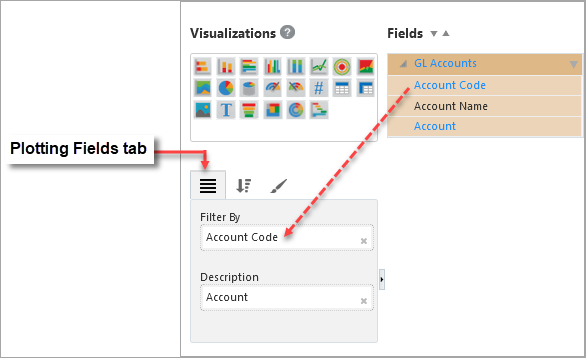
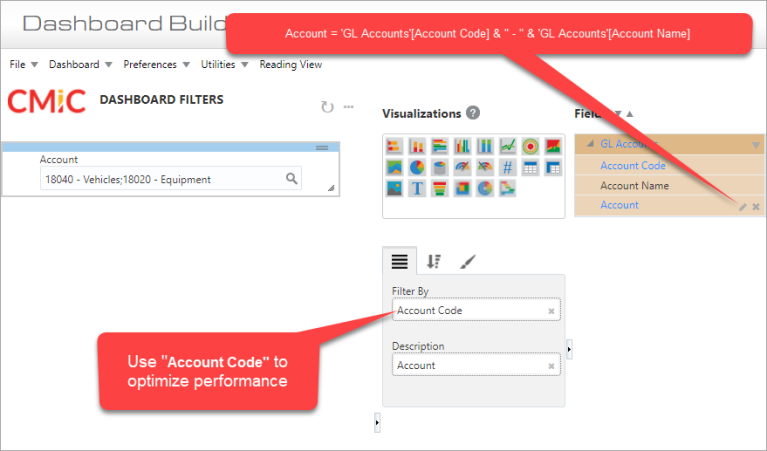
As shown above, drag and drop the field just added to the Fields pane into the Filter By parameter of the Plotting Field tab.
This creates a simple page filter with a pop-up that is auto-populated with relevant values to choose from, as shown below:
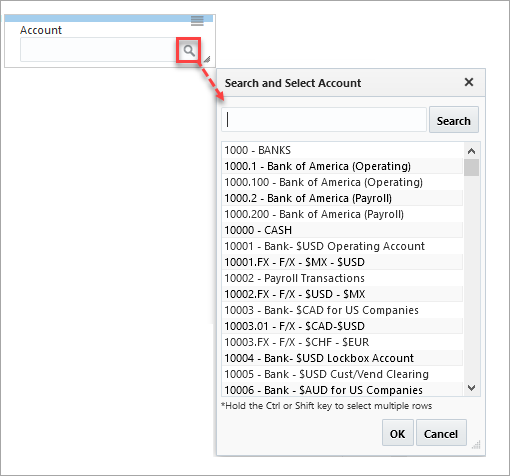
NOTE: A page filter will support the value [Blank] or null. The value [Blank] will be displayed in the list (if it exists) for the selection.
The Description property in the Plotting Field tab is an optional description plotting field. The values of this property will be displayed in the filter's drop-down list.
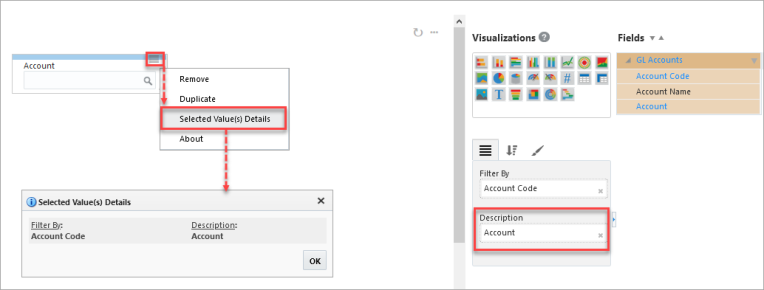
This property allows dashboard designers to:
-
Optimize performance by using an indexed code or oraseq for the Filter By property.
-
Provide a user-friendly list by using the Description property.
Sort and Filter – Tab: Sort & Filter Page Filter’s LOV
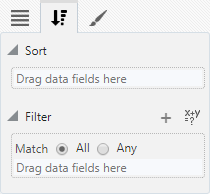
To sort and filter the page filter’s LOV, use the Visualization Properties control’s Sort and Filter tab, as shown above. For details about the Sort and Filter tab, please refer to the following: Sort and Filter – Tab.
Dashboard filter values can be referenced (using substitution value expression) in a visualization filter criterion. Filtering a visualization this way can significantly improve performance if the dashboard filter field's folder contains many rows. Users should remove the dashboard filter field's folder from the Fields panel of the visualization to avoid an unnecessary join.
Format – Tab: Format Page Filter
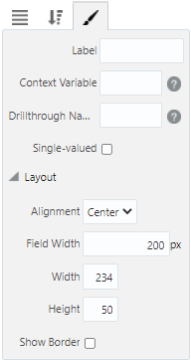
Label: Allows the user to use an alternate label for the page filter, as opposed to using the Field name which defaults from the Filter By parameter of the Visualization Properties control.
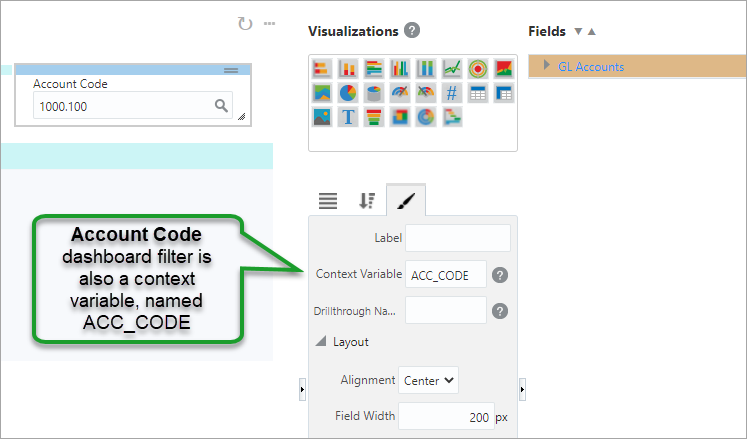
Context Variable: The name of the context variable that is assigned this filter's selected value(s). Refer to Context Variable Name for more details on using advanced drill-down features.
Drillthrough Name: In target dashboards, this name is used to build context variables and substitution value expressions to reference this filter's selected value(s) as drillthrough filter value(s). Refer to Drillthrough Filter Name for more details on using advanced drillthrough.
Single-valued - Checkbox: Used to indicate that the filter can use a single value only. This is useful when using legacy parameterized views with context variables in BI as there are many instances when the legacy views can't consume multi-valued context variables.
Alignment: Used to set how page filter’s search box is aligned within the page filter.
Field Width: Used to set width of page filter’s search box.
Width: Used to set width of page filter.
Height: Used to set height of page filter.
Show Border – Checkbox: Check to apply border to page filter.
Setting Which Visualizations Page Filter Filters
To set what visualizations get filtered by a page filter, add the folder used to create the page filter to all the visualizations that are to be filtered by it. Note, the fields used by the filter do not need to be added to visualizations, only the folder used by the page filter does, even if the folder is not used by the visualization. When a page filter is activated, it looks for visualizations with the same folder, and only ones with it are filtered.
Using Multiple Page Filters Jointly
If multiple page filters are added to filter visualizations jointly, their filter expressions are combined using the And conjunction. Also, page filters that jointly filter visualizations (filter jointly since created using same folder) filter each other.
For instance, for two page filters filtering jointly, one by company and the other by job, if a company is selected using the first one, the second one’s LOV is limited to only jobs belonging to the selected company.
Using Context Variables in a Page Filter
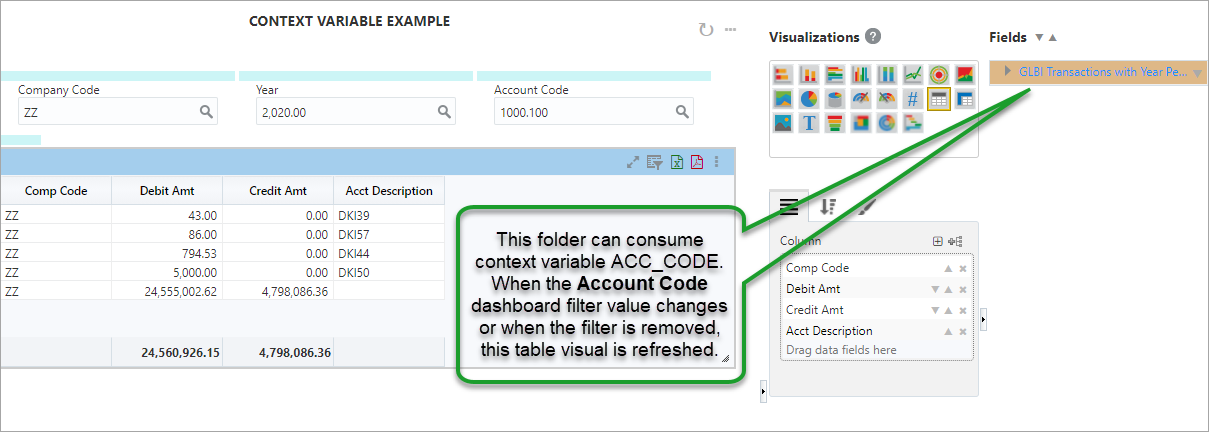
When page filter (dashboard filter) is a context variable, any changes to its value or when it is removed, will refresh all visualizations that are affected by the context variable.
For example:
A dashboard filter is a context variable when its property (see Context Variable property on Format tab of the page filter) contains a context variable name.
A visualization is affected by a context variable when one of its folders contains the context variable name.
The screenshot below shows the context variables defined for folder "GLBI Transactions with Year Period" in BI Catalog Builder.
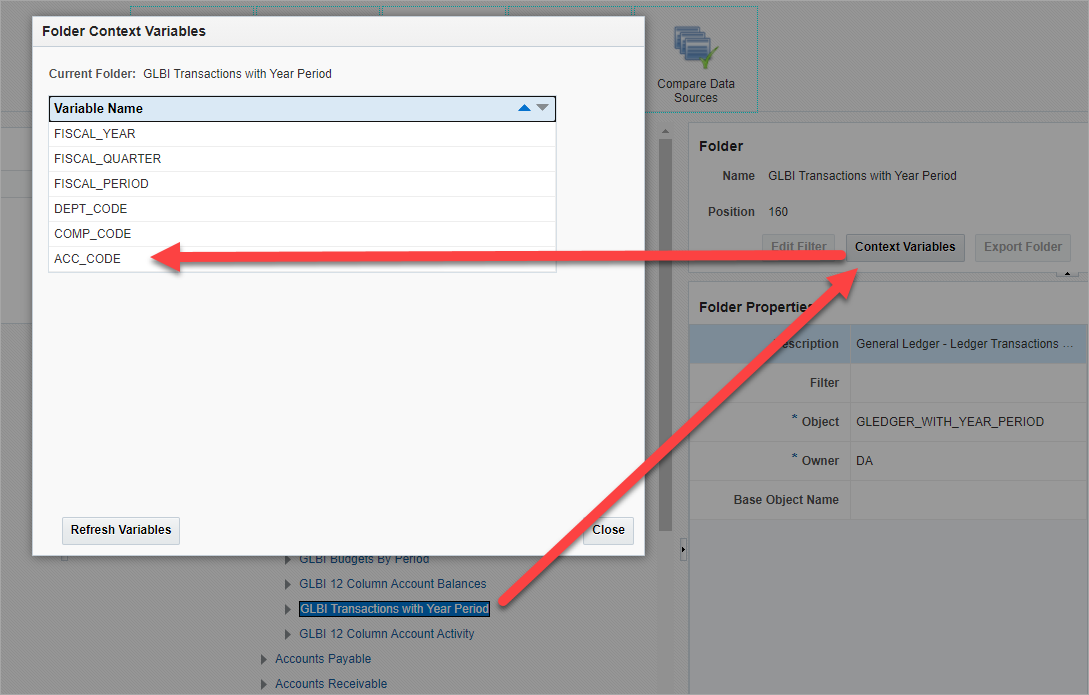
BI Catalog Builder - Edit Data Sources
Insert Line Break
This option is available if the screen is in Edit Mode. To insert a line break, select the visualization for which the next visualizations will be forced to a new line.
Once inserted, the following graphic appears under the selected visualization to indicate where the line break was added:  . The line break can be deleted by selecting its graphic and pressing the Delete keyboard key.
Insert Substitution Variable
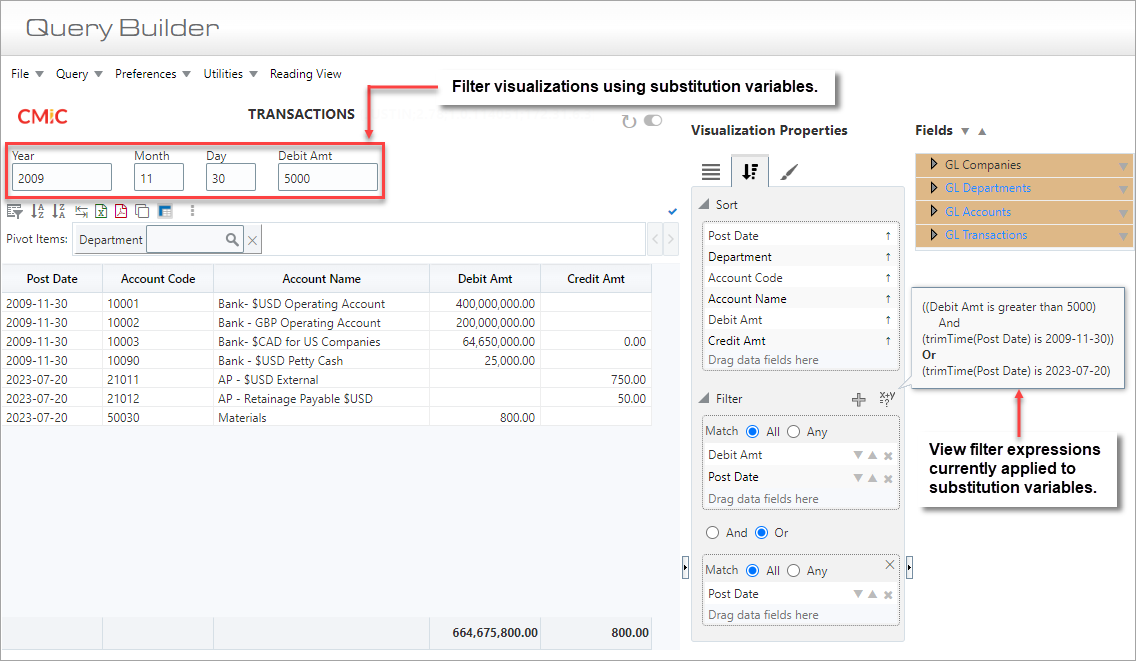
This option is available if the screen is in Edit Mode. It is used to filter visualizations using substitution variables to which substitution value expressions have been applied.
Adding & Configuring Substitution Variable
To add a substitution variable, select the “Insert Substitution Variable” option in the Dashboard drop-down menu, which creates a substitution variable search box at the top of the canvas.
NOTE To clear a substitution variable's selected item, hover over the populated filter and a Clear Filter icon () will appear. Click the icon, and the filter will be instantly cleared.
Format – Tab: Format Substitution Variable
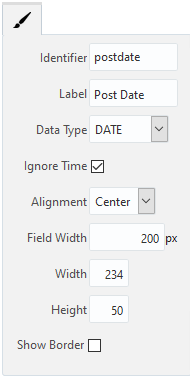
Use the Format tab to complete the substitution variable’s format information. The tab’s fields are described below.
Identifier: A unique name that is used to reference the value of this substitution variable. The identifier must start with a lowercase character and may only contain numbers, lowercase characters and underscores.
Label: Label for substitution variable.
Data Type: Sets the data type of the substitution variable. Options are “String”, “Number”, and “Date”. If “Date” is selected as the data type, the ‘Ignore Time’ checkbox will become enabled. In addition, a pop-up calendar will be available in the Substitution Variable search box. Data validation will occur for Number, Date, and Time.
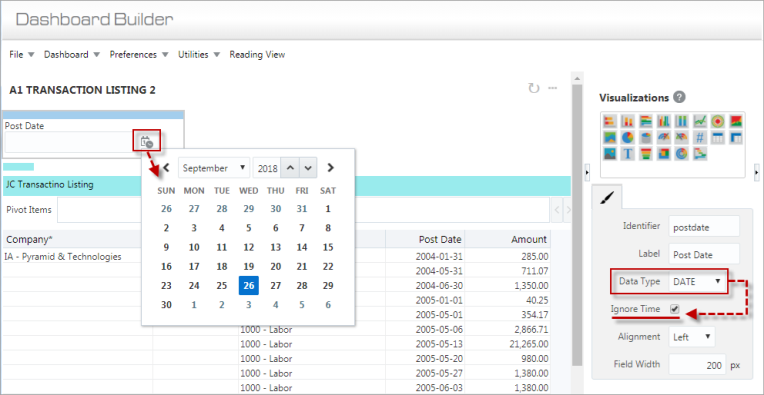
Ignore Time: This checkbox is only visible if “Date” is selected in the Data Type drop-down menu. This box is checked by default. When checked, time will be ignored. If unchecked, time can be specified.
Alignment: Set how substitution variable’s search box is aligned within the substitution variable.
Field Width: Set width of substitution variable’s search box.
Width: Used to set width of the substitution variable.
Height: Use to set height of the substitution variable.
Show Border – Checkbox: Check to apply border to the substitution variable.
Sort and Filter – Tab: Sort & Filter
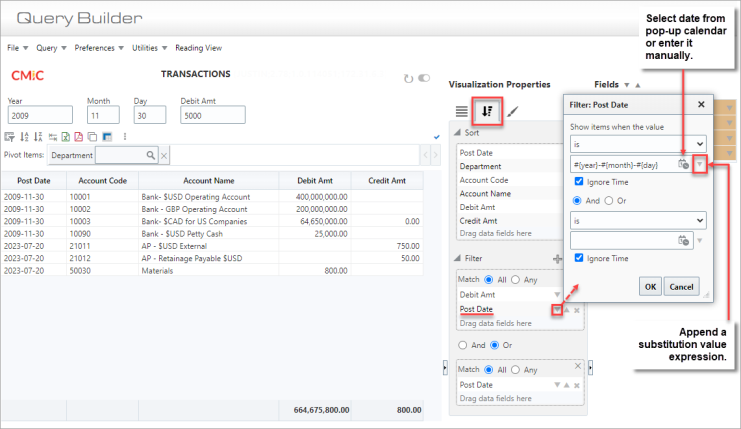
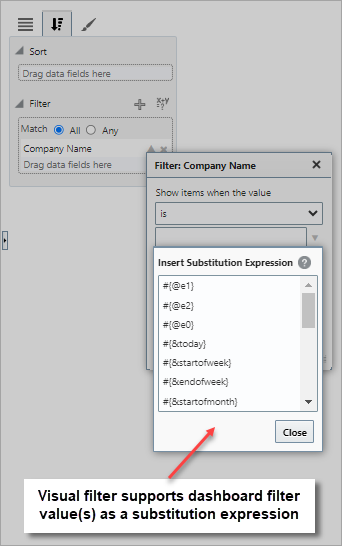
Use the Visualization Properties control’s Sort and Filter tab, as shown above, to enter substitution value expression(s) to the fields in the Filter panel. The value of a number or date criterion may contain one or more substitution value expressions (e.g. #{identifier}).
Substitution value expressions can be inserted by selecting them from the drop-down menu, as shown below.
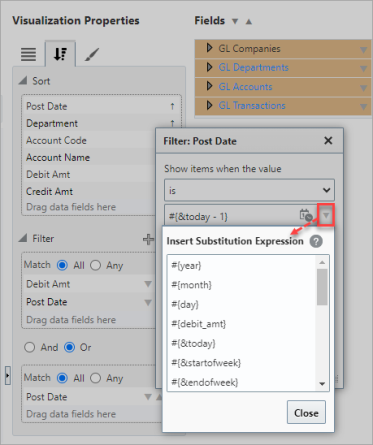
Click on the help icon  in the Insert Substitution Expression pop-up window to display all available substitution value expressions. Hovering over an expression in the help pop-up will show its resolved value.
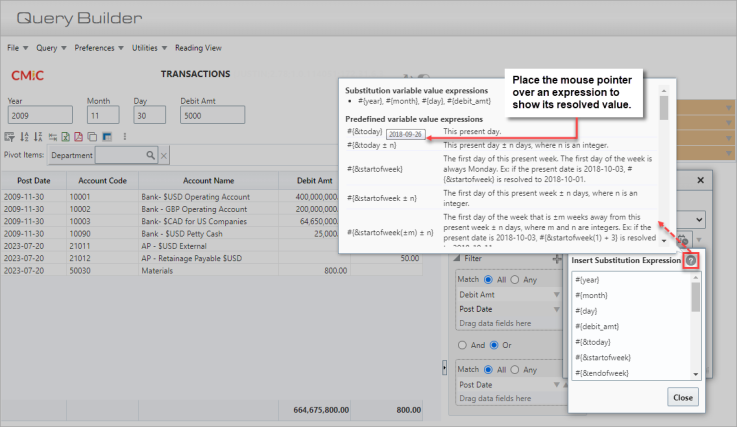
A predefined substitution variable identifier always starts with an “&”. The following pre-defined substitution value expressions are available to use:
|
Predefined Substitution Value Expression |
Description |
|---|---|
|
#{&today} |
This present day. |
|
#{&today ± n} |
This present day ± n days, where n is an integer. |
|
#{&startofweek} |
The first day of this present week. The first day of the week is always Monday. E.g.: If the present date is 2018-10-03, #{&startofweek} is resolved to 2018-10-01. |
|
#{&startofweek ± n} |
The first day of this present week ± n days, where n is an integer. |
|
#{&startofweek(±m) ± n} |
The first day of the week that is ±m weeks away from this present week ± n days, where m and n are integers. E.g.: If the present date is 2018-10-03, #{&startofweek(1) + 3} is resolved to 2018-10-11. |
|
#{&endofweek} |
The last day of this present week. The last day of the week is always Sunday. E.g.: If the present date is 2018-10-03, #{&endofweek} is resolved to 2018-10-07. |
|
#{&endofweek ± n} |
The last day of this present week ± n days, where n is an integer. |
|
#{&endofweek(±m) ± n} |
The last day of the week that is ±m weeks away from this present week ± n days, where m and n are integers. E.g.: If the present date is 2018-10-03, #{&endofweek(-3) + 2} is resolved to 2018-09-18. |
|
#{&startofmonth} |
The first day of this present month. E.g.: If the present date is 2018-07-20, #{&startofmonth} is resolved to 2018-07-01. |
|
#{&startofmonth ± n} |
The first day of this present month ± n days, where n is an integer. |
|
#{&startofmonth(±m) ± n} |
The first day of the month that is ±m months away from this present month ± n days, where m and n are integers. E.g.: If the present date is 2018-07-20, #{&startofmonth(2) + 1} is resolved to 2018-09-02. |
|
#{&endofmonth} |
The last day of this present month. E.g.: If the present date is 2018-07-20, #{&endofmonth} is resolved to 2018-07-31. |
|
#{&endofmonth ± n} |
The last day of this present month ± n days, where n is an integer. |
|
#{&endofmonth(±m) ± n} |
The last day of the month that is ±m months away from this present month ± n days, where m and n are integers. E.g.: If the present date is 2018-07-20, #{&endofmonth(-2) - 1} is resolved to 2018-05-30. |
|
#{&startofquarter} |
The first day of this present quarter. E.g.: If the present date is 2018-09-20, #{&startofquarter} is resolved to 2018-07-01. |
|
#{&startofquarter ± n} |
The first day of this present quarter ± n days, where n is an integer. |
|
#{&startofquarter(±m) ± n} |
The first day of the quarter that is ±m quarters away from this present quarter ± n days, where m and n are integers. E.g.: If the present date is 2018-09-20, #{&startofquarter(1) + 1} is resolved to 2018-10-02. |
|
#{&endofquarter} |
The last day of this present quarter. E.g.: If the present date is 2018-09-20, #{&endofquarter} is resolved to 2018-09-30. |
|
#{&endofquarter ± n} |
The last day of this present quarter ± n days, where n is an integer. |
|
#{&endofquarter(±m) ± n} |
The last day of the quarter that is ±m quarters away from this present quarter ± n days, where m and n are integers. Eg.: If the present date is 2018-09-20, #{&endofquarter(1) - 1} is resolved to 2018-12-30. |
|
#{&startofyear} |
The first day of this present year. E.g.: If the present date is 2018-09-20, #{&startofyear} is resolved to 2018-01-01. |
|
#{&startofyear ± n} |
The first day of this present year ± n days, where n is an integer. |
|
#{&startofyear(±m) ± n} |
The first day of the year that is ±m years away from this present year ± n days, where m and n are integers. E.g.: If the present date is 2018-09-20, #{&startofyear(10) + 1} is resolved to 2028-01-02. |
|
#{&endofyear} |
The last day of this present year. E.g.: If the present date is 2018-09-20, #{&endofyear} is resolved to 2018-12-31. |
|
#{&endofyear ± n} |
The last day of this present year ± n days, where n is an integer. |
|
#{&endofyear(±m) ± n} |
The last day of the year that is ±m years away from this present year ± n days, where m and n are integers. E.g.: If the present date is 2018-09-20, #{&endofyear(-10) - 1} is resolved to 2008-12-30. |
|
#{&userloginname} |
Login name of the current user. |
|
#{&userdisplayname} |
Display name of the current user. |
|
#{&glcompanycode} |
Default GL company code. |
|
#{&gldepartmentcode} |
Default GL department code. |
|
#{&projectoraseq} |
Current project oraseq. |
|
#{&partnertypecode} |
Partner type code of the current user. |
|
#{&partnercode} |
Partner or company code of the current user. |
|
#{&contactcode} |
Contact code of the current user. |
NOTE: A visualization filter criterion is removed from the query when any of the following conditions occur:
- Criterion value contains a substitution variable identifier that does not exist.
- Criterion value is resolved to null or blank.
- For number criteria, criterion value cannot be resolved to a number.
- For date criteria, criterion value cannot be resolved to a date.
For more details about the Sort and Filter tab, please refer to the following
Insert Panel
The Insert Panel menu option adds a visualization panel to a dashboard. A panel is a container used to arrange and group visualizations in a dashboard. Similar to other visualizations, panels can be re-arranged on a dashboard. The visualizations inside a panel are arranged in fixed positions and they can be stacked.
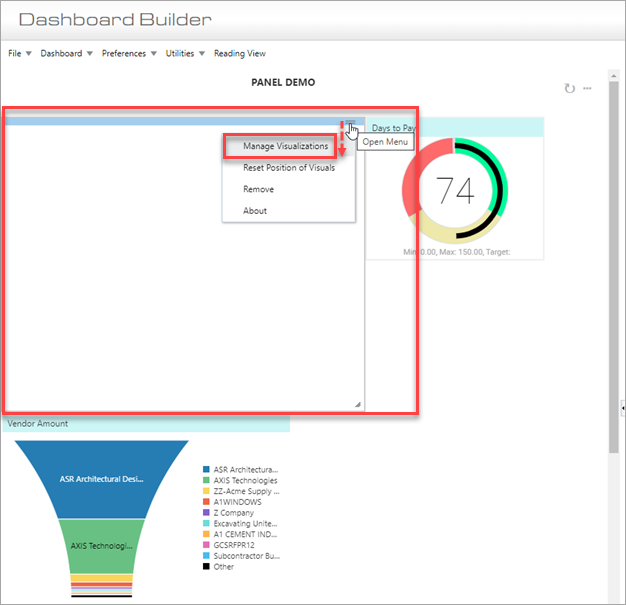
Click on the Panel's drop-down menu and select "Manage Visualizations" to add visualizations to the panel.
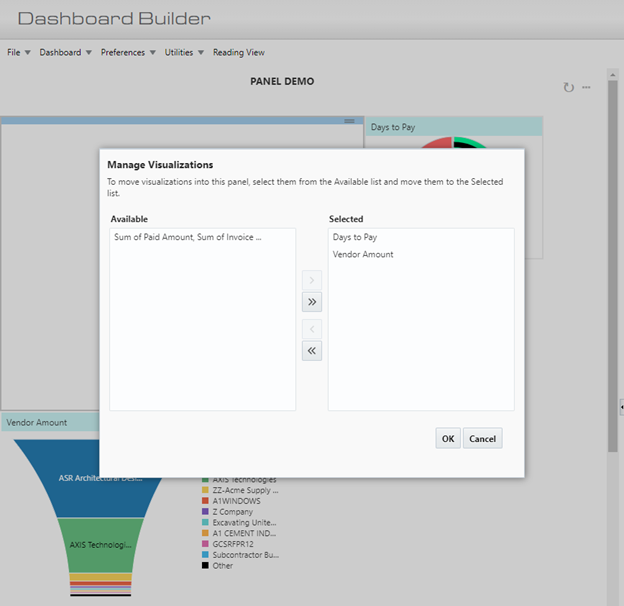
In the Manage Visualizations pop-up window, visualizations can be moved into the panel by selecting them from the Available list and clicking on the Move button ( ) to move them over into the Selected list.
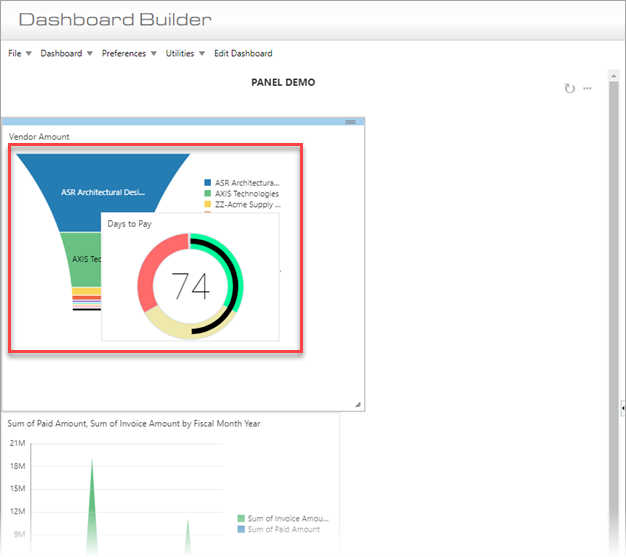
The selected visualizations will be added to the panel.
Context Information
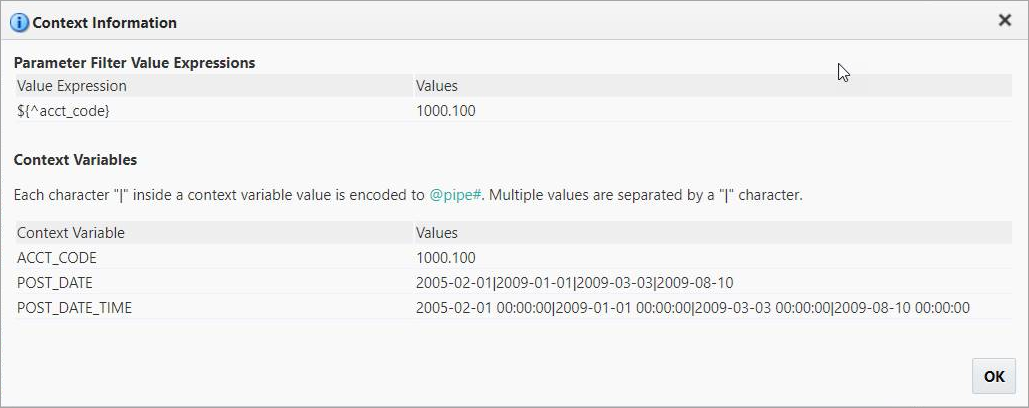
The Context Information pop-up window is used to show context variables and values, as well as filter value expressions and values.
Performance Analysis
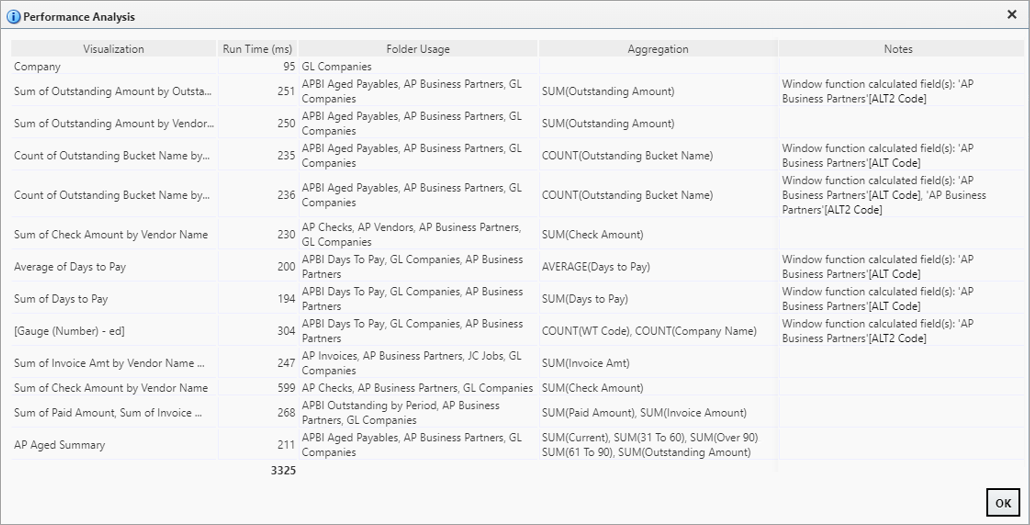
The Performance Analysis pop-up window summarizes the performance of the dashboard. Each row in the pop-up window represents a visualization. Hovering your mouse over an individual row will highlight the corresponding visualization with an outline in the dashboard.
This feature allows users to analyze the load time of specific visualizations on their BI reports. The performance analysis helps users narrow down the visualizations that take long to load. It also shows the folders and calculated fields that are employed by each visualization
To learn more about improving the performance of your BI reports, refer to BI Dashboard Builder - Designing Fast BI Reports.
Get Link
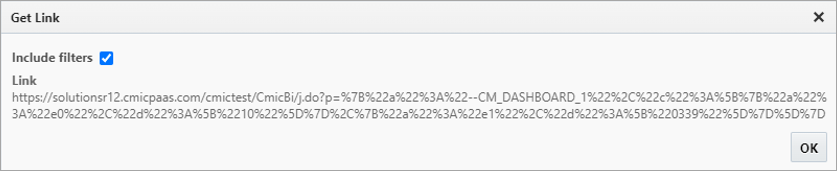
This option launches a pop-up which displays the URL for the dashboard, which can be right-clicked and copied using the context menu that appears. The 'Include filters' checkbox is used to control whether filters are included in the link. If checked, then the URL will be updated accordingly so if the link is copied and shared, it will contain the pre-defined filters.
Discard Changes
This option launches a pop-up which prompts the user to confirm the discarding of all unsaved changes. Click [OK] to revert the dashboard back to the way it was before the unsaved changes.
Delete
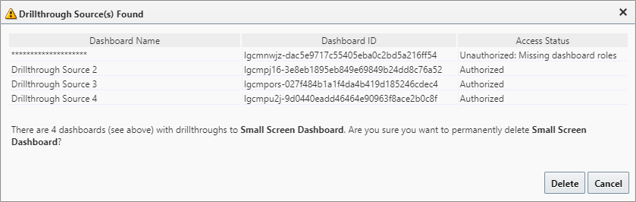
This option launches a pop-up which prompts the user to confirm the deletion of current dashboard. It also warns the user if the dashboard being deleted is referenced by another dashboard via drillthrough(s).
NOTE: The warning may list dashboards to which the user does not have access.
Click [Delete] to permanently delete it.