Overview
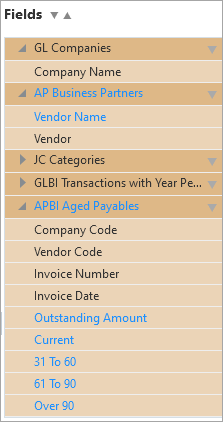
This pane needs to contain all the folders and fields required for a visualization or a page filter (“Insert Filter” option under Dashboard drop-down menu).
NOTE: If no business areas and fields are shown and the up and down arrows ( ) are not visible, no visualization is selected on the dashboard canvas. Ensure a visualization is selected for these items to be displayed.
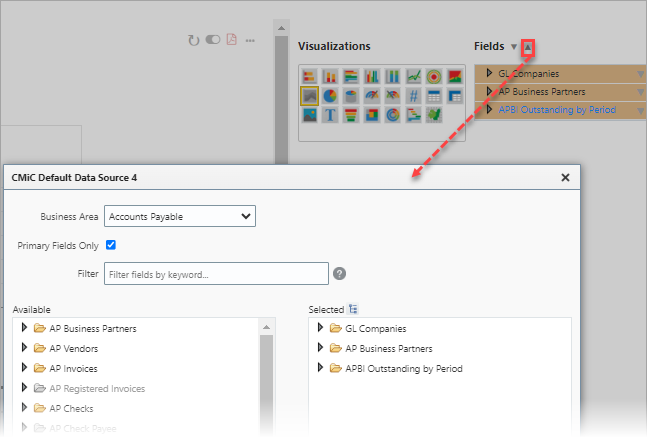
To add fields to a visualization or a page filter, select it on the dashboard canvas and click the up-arrow ( ) in the Fields pane.
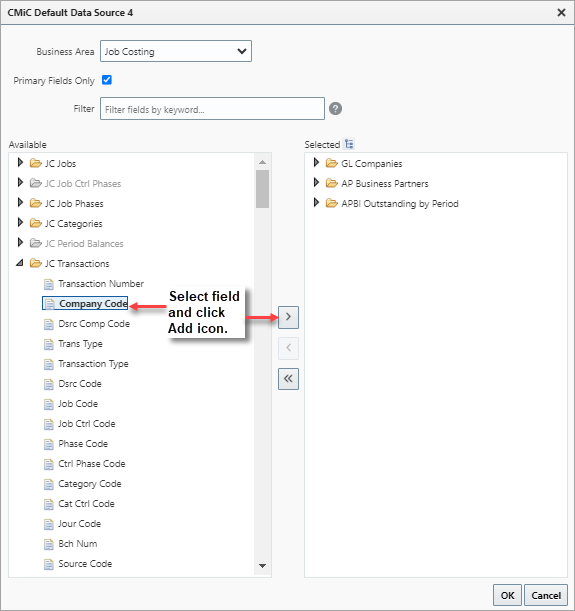
In the launched Default Data Source pop-up window, select a field to add in the Available pane, then click the Add icon (single arrow) to move it to the Selected pane, which adds the field and its folder to the visualization.
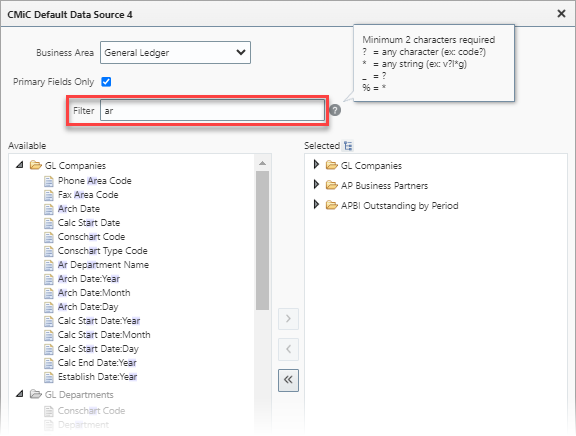
A Filter box is provided which allows users to search for specific fields. When a minimum of two characters are entered in the filter, matching field results will be highlighted in the Available pane. The Help icon ( ) displays a list of available wildcards that can be used when performing these searches. When finished, select any relevant fields and add them to the Selected pane.
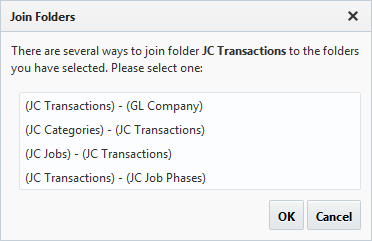
When a field is added to the Selected pane, if its folder has joins to more than one of the folders already selected (joins specified via BI Catalog Builder tool), a pop-up is displayed to select to which folder it is to be joined, as shown below:
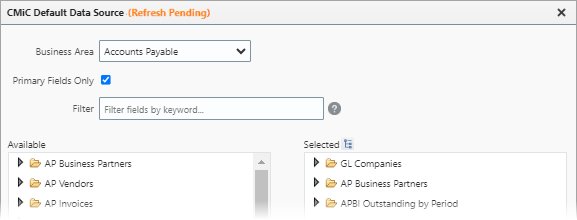
NOTE: Dashboard users are not blocked waiting for a data source refresh. When a data source is queued for refresh, the "(Refresh Pending)" suffix is added to the data source name on the Default Data Source pop-up window as shown below.
Join Tree
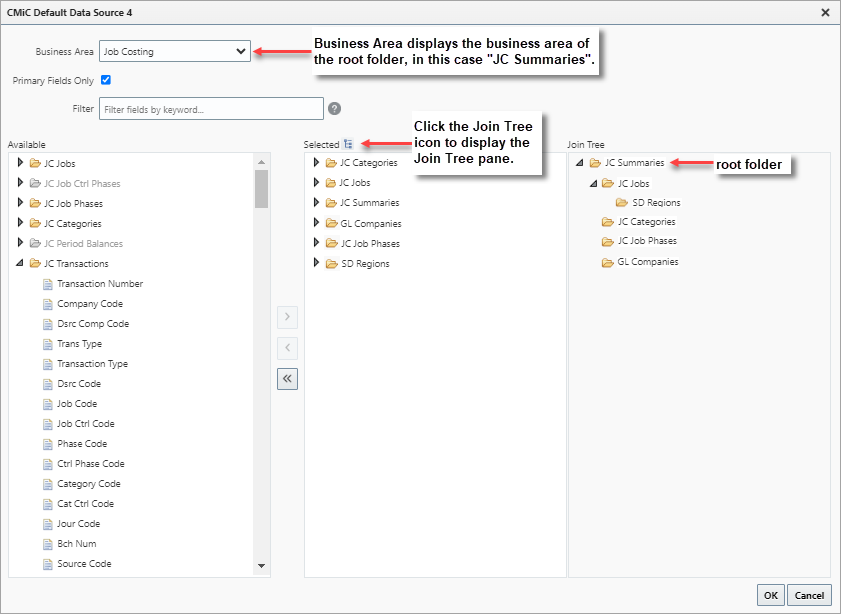
To view how the selected folders are joined, click the Join Tree icon ( ) to display the Join Tree pane. Joins are used to combine data from two or more tables based on a related column between them.
The top-most folder is the root folder, and if it is removed from the Selected pane, all other folders will also be removed from the Selected pane.
By default, the Business Area displays the business area of the root folder.
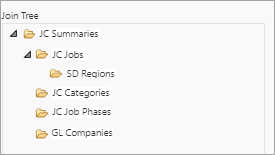
Using the following Join Tree as an example, Join Trees show how the selected folders are joined as follows:
-
Top-most (root) folder (JC Summaries) is joined to all sub-folders, but not to their sub-folders, e.g., JC Summaries is joined to JC Jobs, JC Categories, JC Job Phases, and GL Company.
-
Sub-folders are joined to their sub-folders, e.g., JC Jobs is joined to SD Regions.
New Calculated Field, Supported Context Variables, Show Description
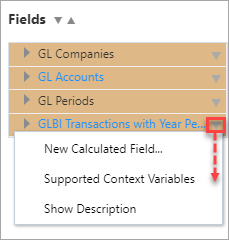
Clicking on the down arrow ( ) beside a folder in the Fields pane provides three options: "New Calculated Field", "Supported Context Variables", and "Show Description".
New Calculated Field
This option allows visualization calculated fields to be created and added to a folder in BI Dashboard Builder. Refer to Visualization Calculated Fields for more information.
Supported Context Variables

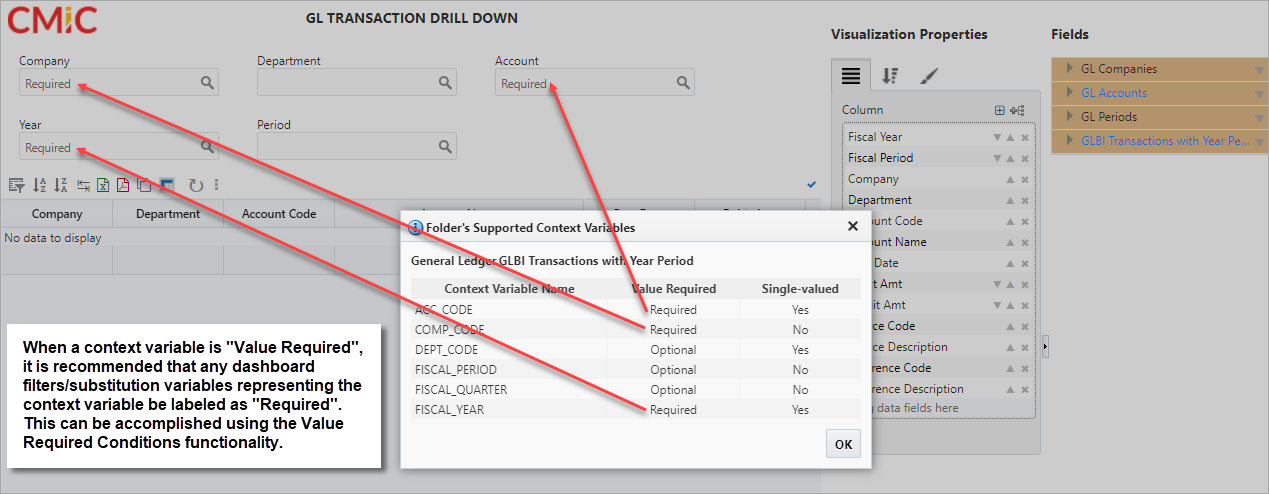
This option displays a folder’s supported context variables in a pop-up window. This information is also available in BI Catalog Builder. The pop-up window includes context variable attributes (Value Required and Single-valued), which are specified in BI Catalog Builder.
When a context variable is “Value Required”, the underlying SQL view of the folder will only return data when it receives the context variable with a value. It is recommended that any dashboard filters or substitution variables representing the context variable be marked as required. This can be accomplished using the "Value Required" functionality.
Unless a context variable can have more than one value at one time (as specified in BI Catalog Builder), it is assumed to be single-valued. Any dashboard filter(s) representing a single-valued context variable is automatically single-valued. Multiple value selection is disabled and the dashboard filter’s Single-valued property is automatically checked.
Show Description
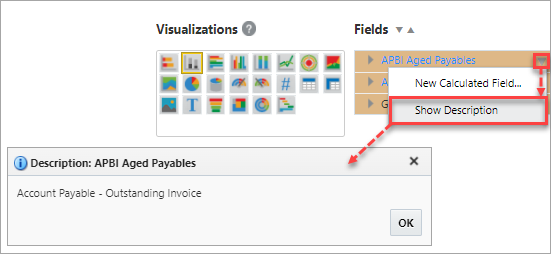
This option allows users to view the folder description specified in BI Catalog Builder.
Removing Fields
When a field is deleted in BI Catalog Builder, visualizations in BI Dashboard Builder currently using the deleted field will no longer display properly.
For the visualization to display properly, the missing field needs to be removed from the Fields pane. In order to be able to remove a field from the Fields pane, the field must not be used. If the field is being used as a plotting field, filter field, sort field, etc., the user will be prompted to remove its usages first.
NOTE: A field is being used if its font is blue in the Fields pane; otherwise, an unused field’s font is black.
The screenshot below shows an example of a visualization not displaying properly because a field being used as a plotting field has been deleted. For the visualization to display properly, the user needs to remove the missing field’s usage first, in this case on the Plotting Fields tab, and then remove the field from the Fields pane.
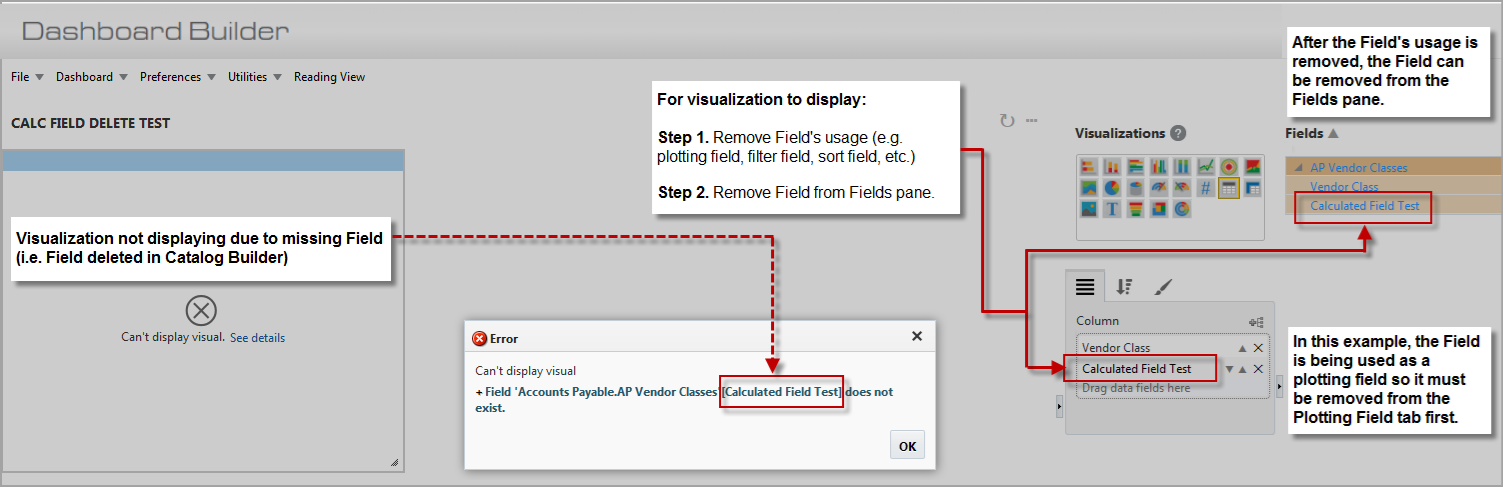
Example of removing a field from a visualization’s Fields pane
Visualization Calculated Fields
Visualization calculated (custom) fields can be created and added to a folder in BI Dashboard Builder for each visualization. A visualization calculated field in BI Dashboard Builder can be constructed using fields from any folders using a valid BI expression. Every visualization calculated field expression starts with the field name then an = sign followed by a BI expression. For example, the following expression creates a Total Cost visualization calculated field by multiplying the Unit Cost to Quantity.
Total Cost = 'Sales'[Unit Cost] * 'Sales'[Quantity]
NOTE: A visualization calculated field can be created for all visualizations except the Dashboard Filter.
Expression Operators and Precedence Rules
A BI expression supports the following arithmetic operators:
+ (addition)
- (subtraction)
* (multiplication)
/ (division)
The text concatenation operator & is used to construct two or more string/URL to form a longer string/URL.
Parentheses can be used in an arithmetic expression to change the order of evaluation. In an expression like:
New Amount A = ('Folder 1'[Amount 1] - 'Folder 2'[Amount 2]) / 'Folder 3'[Amount 3]
the part of the expression within the parentheses, ('Folder 1'[Amount 1] - 'Folder 2'[Amount 2]), is evaluated first, and then the result is used in the rest of the expression.
Syntax Requirements
String literal is enclosed in double quotes (“).
A backslash (\) is an escape sequence and has special meaning in BI Dashboard Builder. A string literal may contain a double quote if it is preceded by a backslash (\).
A string literal may contain a backslash if it is preceded by another backslash. For example, to create a Message field containing text: The file "test.txt" is located at C:\Temp\
Message = "The file \"test.txt\" is located at C:\\Temp\\"
To insert a new line in the text, use the special escape sequence \n. For example:
Two Lines = "Line 1\nLine2"
Field Reference
A field reference is constructed in the following format:
‘Folder Name’[Field Name]
The folder name part is enclosed in single quotes (‘) and the succeeding field name part is enclosed in square brackets ([ ]).
Functions
A BI expression may contain functions. A function may have required and optional arguments. When a function is executed, a single value is returned, and then the value is used in the rest of the expression. The following functions are currently supported:
blank
Returns a blank.
Syntax:
blank()
switch
The switch function converts a field reference’s values against a list of values and returns one of multiple possible result.
Syntax:
switch(<expression>, <value>, <result>[, <value>, <result>]…[, <else>])
<expression> any expression that returns a single value.
<value> a value to be matched with the result of expression. This value can be an expression.
<result> any expression to be evaluated if the result of expression match the corresponding value.
<else> any expression to be evaluated if the result of expression doesn't match any of the value arguments.
The data type of the <expression reference> must be the same as the comparison <value>’s data type. The data type of the result must be the same as the visualization calculated field’s data type.
search
Returns the number of the characters at which a text string is first found, reading left to right. When the text string is not found, it returns 0.
Syntax:
search(<findText>,<withinText>)
<findText>: The text that you want to find. Regular expressions are supported. For example, a question mark (?) matches any single character; an asterisk (*) matches any sequence of characters.
<withinText>: The text in which you want to search for findText, or a column containing text. withinText can also be an expression returning the text.
Examples:
Total A = switch(search("total", 'folder'[string field]), 0, "Not Total", "Total")
Total B = switch(true, search("sum", 'folder'[string field]) > 0, “Total”, “Not Total”);
Use regex logical or operator |
Total C = switch(search("total|sum", 'folder'[string field]), 0, "Not Total", "Total")
Allow string fields or string expressions to be used with comparison operators (==, !=, <, <=, >, >= ). For example:
New Field 1 = switch(true, ‘folder’[text field] == “Some Value”,1,0)
NOTE: The search function and text comparisons in BI are case-insensitive.
date
Returns the specified date in the DATE data type.
Syntax:
date(<year>, <month>, <day>)
<year>: a number expression representing the year.
<month>: a number expression from 1 to 12 representing the month.
<day>: a number expression from 1 to 31 representing the day.
date.now
Returns the current server date and time.
Syntax:
date.now()
date.addDays
Returns the date result from adding numberOfDays days to the dateTime value.
Syntax:
date.addDays(<dateTime>, <numberOfDays>)
<dateTime> a date expression to which days are being added..
<numberOfDays> is a positive or negative number of days to add to <dateTime>. It can be a number expression.
length
The length function is used to determine the total number of characters in a string. This includes all characters, such as letters, numbers, punctuation marks, and whitespace (spaces, tabs, and newlines). It is commonly used when you need to validate input length, measure content size, or perform formatting operations.
This function is only applicable to strings, it does not count elements in arrays or other data types unless explicitly converted to a string.
Syntax:
length('folder'[string field])
trim
The trim function is used to remove whitespace characters from the beginning and end of a string. This includes spaces, tabs, and newline characters. It is especially useful when cleaning up user input, processing data from files, or preparing strings for comparison or storage.
Importantly, trim does not remove spaces or characters within the string, only those at the edges.
Syntax:
trim('folder'[string field])
date.dayDifference
The dayDifference function is used to calculate the number of days between two date values. It takes two date fields as input and returns an integer representing the difference in days. This function is specifically for date fields and is commonly used in data analysis, reporting, or time-based calculations.
-
If the first date is earlier than the second, the result is negative.
-
If the first date is later, the result is positive.
-
If both dates are the same, the result is zero.
Syntax:
date.dayDifference( 'folder A'[date field 1], 'folder B'[date field 2] )
Nested Function Calls
The result of a function call can be used in the parameter evaluation for another function call.
For example:
Rating = switch(true,
'Folder'[Amt] < 10, "A",
('Folder'[Amt] + switch('Folder'[Type],"Assets", 100, 0)) <= 10000, "AA",
"Other")
date.daydifference
Returns the number of days between two dates.
Syntax:
date.daydifference(<date1>, <date2>)
<date1> a datetime value/expression.
<date2> a datetime value/expression.
Examples
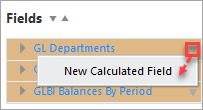
Visualization calculated fields can be created and added to a folder in BI Dashboard Builder by clicking on the down arrow () beside a folder in the Fields pane.
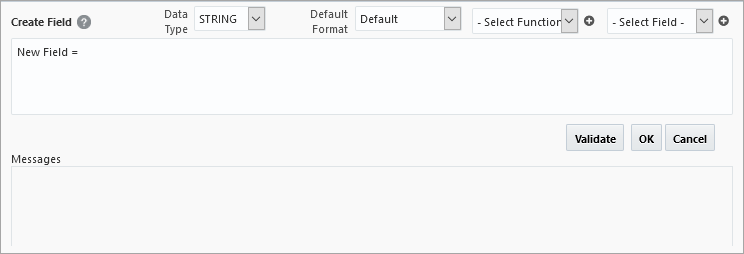
The drop-down lists are used to make selections and the Insert icon (![]() ) is added to each list to explicitly insert the selected value.
) is added to each list to explicitly insert the selected value.
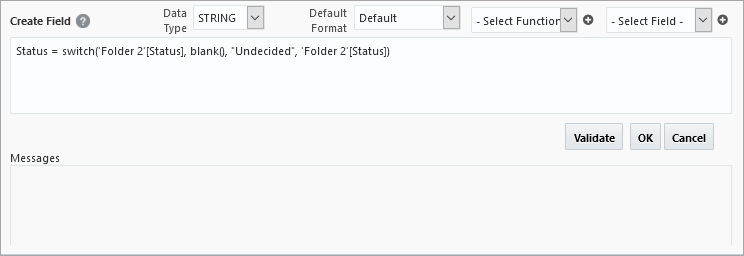
Create a STRING visualization calculated field that sets all blank status to “Undecided”.
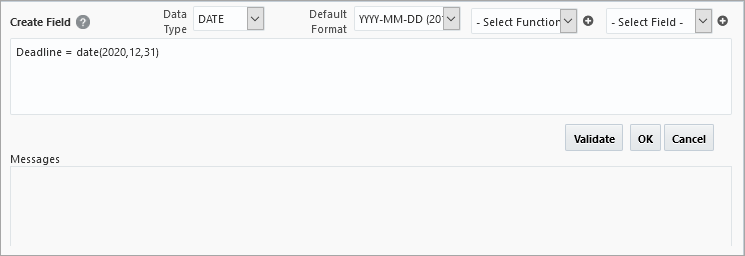
Create a DATE visualization calculated field that sets all blank project end dates to December 31st, 2022.

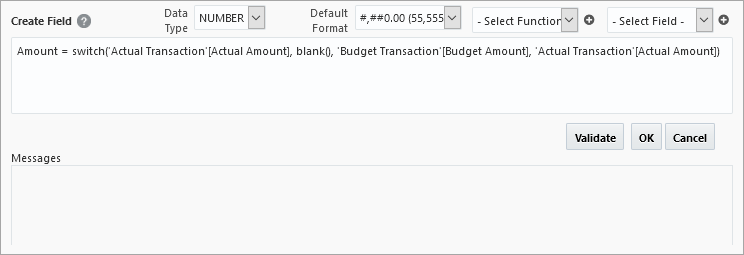
Create a NUMBER visualization calculated field that uses the budgeted amount if the actual amount is missing/blank.
Create a DATE visualization calculated field that is a date constant.
Creating Calculated Fields in BI Catalog Builder
Visualizations can also use calculated fields, which are custom fields created and added to a folder in BI Catalog Builder, using the Create Calculated Field pop-up shown below:
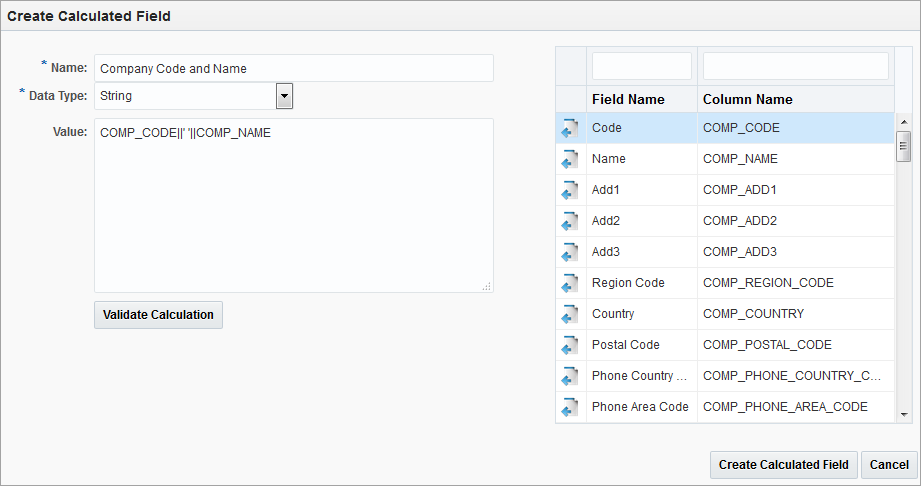
Create Calculated Field pop-up window in BI Catalog Builder
NOTE: Calculated fields created in BI Dashboard Builder are referred to as visualization calculated fields.
When a calculated field is added to a folder (i.e., table/view), a column for the new field is added to it, and each of its rows has the new calculated field.
For each row, the calculated field displays the result of an SQL expression, which can include any Oracle SQL function and operator, and can contain references to any fields in the folder to specify values. A field referenced in an SQL expression represents the value of that field in the particular row of the calculated field being evaluated.
NOTE: In BI Dashboard Builder, a visualization calculated field can be constructed using fields from any folder in a data source. In contrast, a calculated field in BI Catalog Builder can be constructed using fields from the same folder only.
A calculated field can also be created to launch a program from a field using targets. Refer to BI Dashboard Builder - Table Visualizations for more information.
For details about creating and adding calculated fields to a folder, please refer to the BI Catalog Builder guide.
Using AI Assistant for Calculated Fields
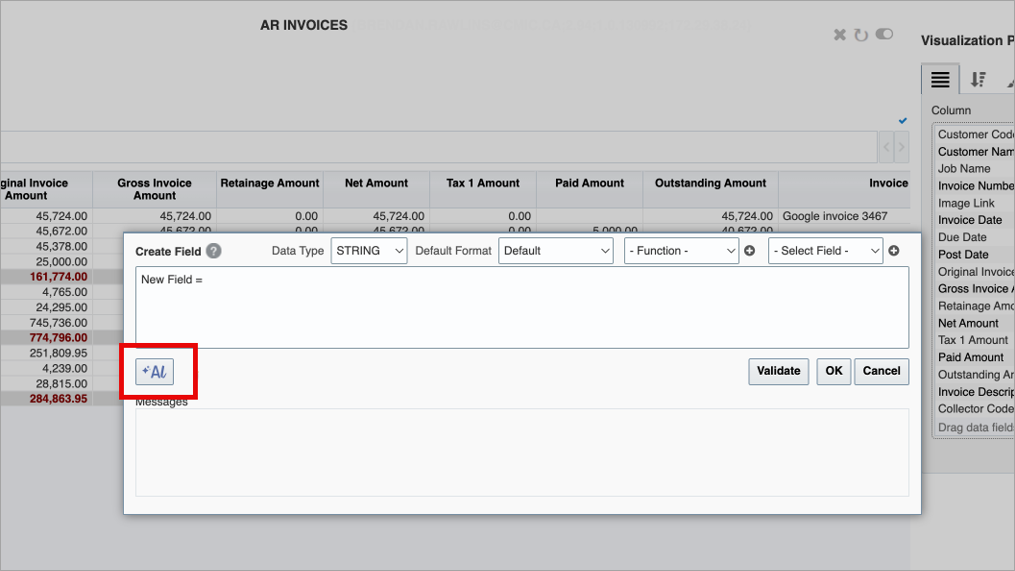
An [AI] button is available in the Create Field pop-up window to assist with building calculated fields. This feature translates plain-language instructions into structured logic, making it easier to create complex expressions. With a single click, the AI Assistant interprets your input and generates a switch statement that’s ready to use or customize further.
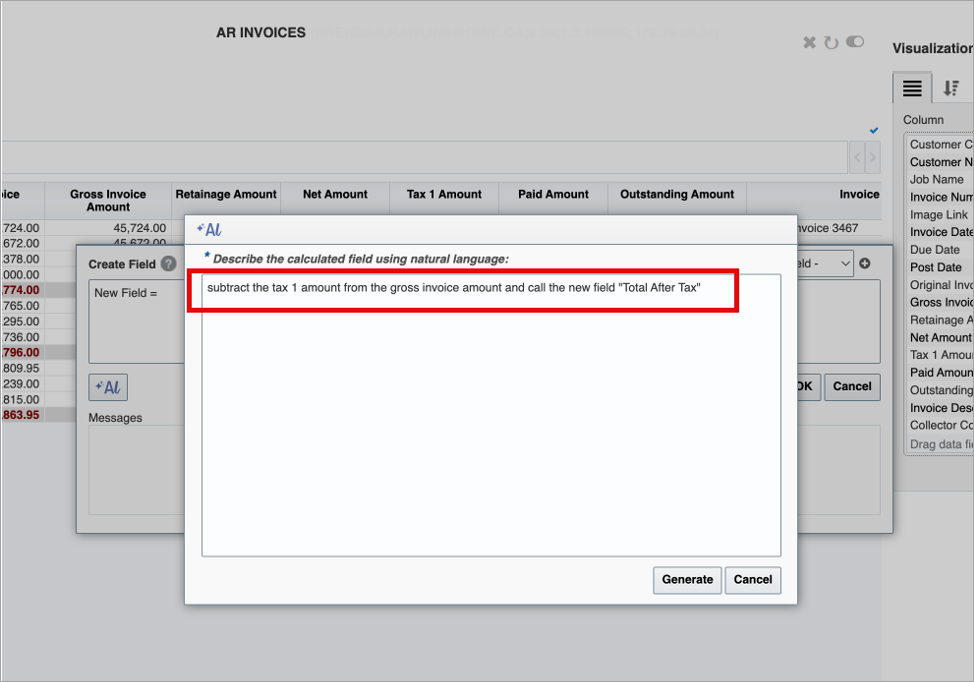
After clicking the [AI] button, enter a description of the field using natural language in the AI pop-up window. When you are ready, click the [Generate] button to create the expression.
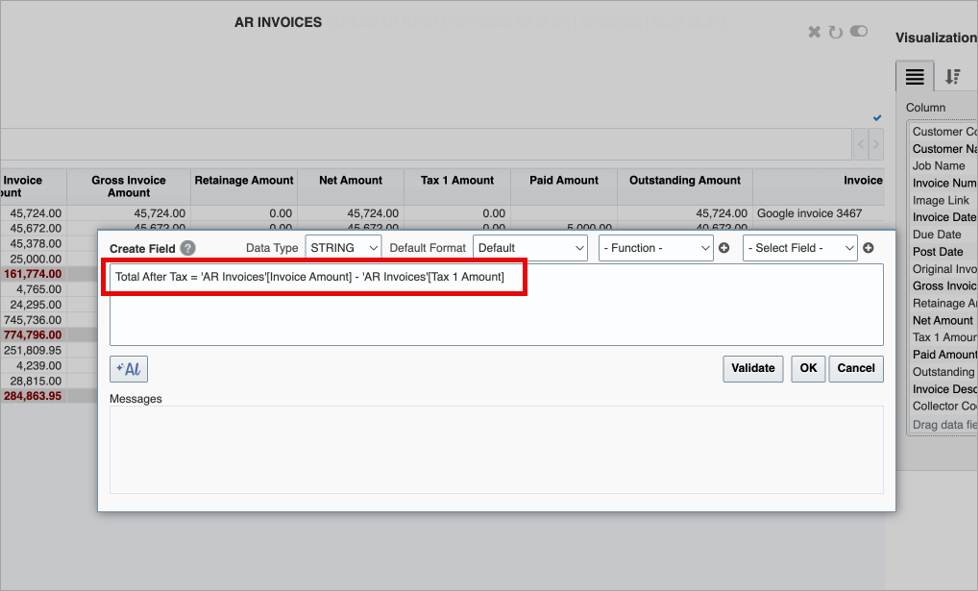
The AI Assistant will generate the appropriate numeric expression for you. Click [OK] to apply the expression directly to your data
Editing Data Sources, Business Areas, Folders and Fields in Catalog Builder
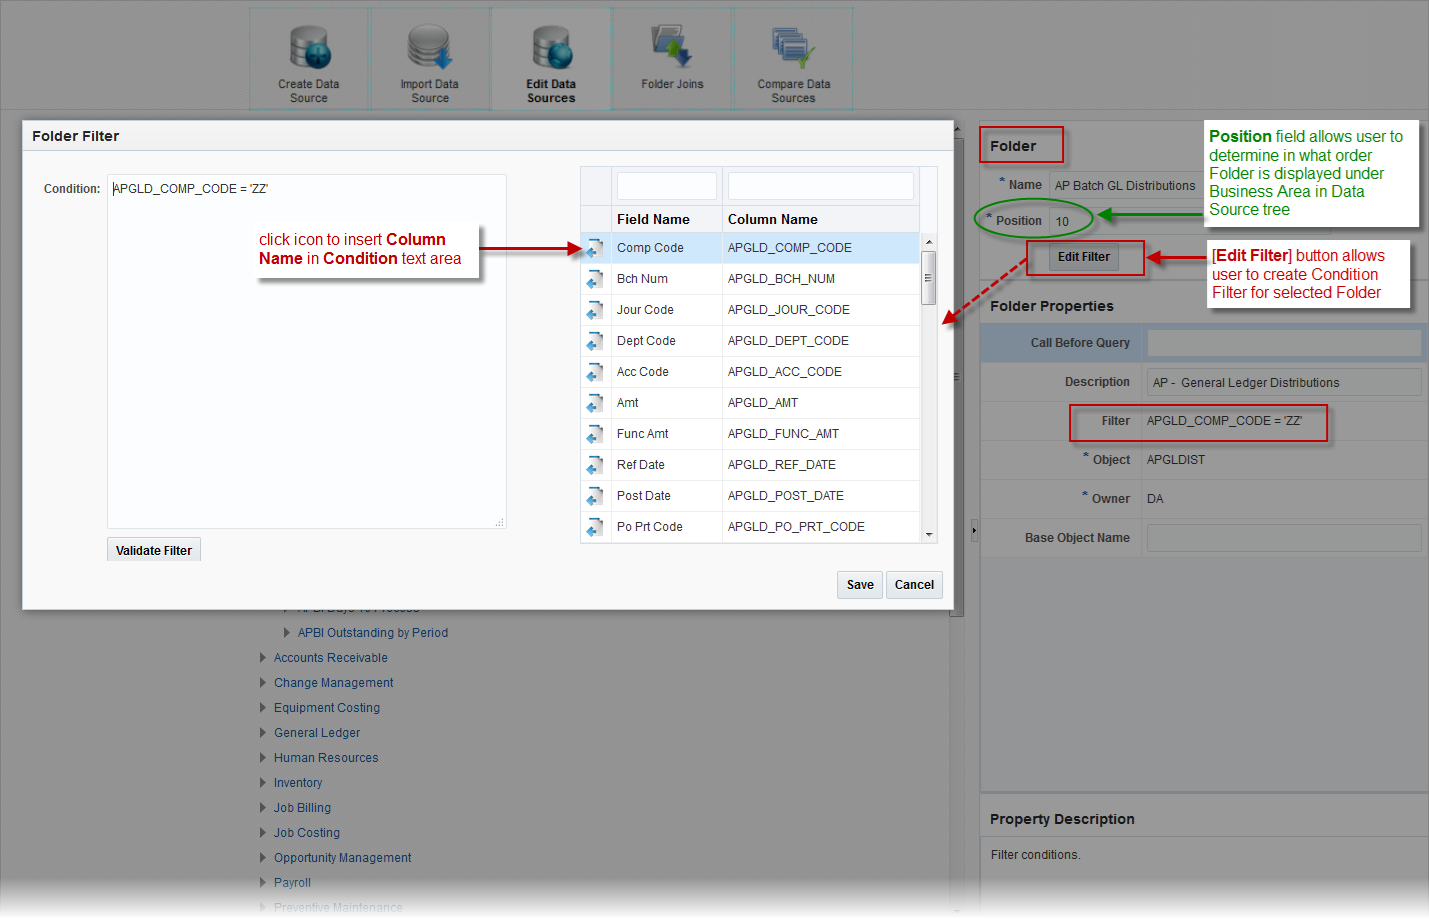
Example of editing a folder in Catalog Builder by specifying position of folder node inside branch and applying a filter condition
The order in which business areas, folders and fields are displayed in a data source tree is determined in Catalog Builder. In the Property Pane section for each of these items, there is a property called Position which sets the position of the item’s node inside a data source branch. The Position property is editable, allowing the user to change the position of a node to control the order in which business areas are displayed in a data source, folders are displayed in a business area, and fields are displayed in a folder.
In addition, users can specify filter conditions to restrict the number of records returned by a folder using the [Edit Filter] button. This feature is available to Enterprise and Cloud Catalog Builder clients only, and users must have the system privilege BICFDRFLTR to use it; otherwise, the button will be hidden.
The application that performs the actual restriction is BI Dashboard Builder.
For example, the screenshot above shows an example of the folder “AP Batch GL Distributions” in BI Catalog Builder, in which the position of the folder node inside the business area (Accounts Payable) is specified as “10” and a filter condition has been specified for the folder so that it will only return records when its “Comp Code” is “ZZ”.
For more information, please refer to the BI Catalog Builder guide.
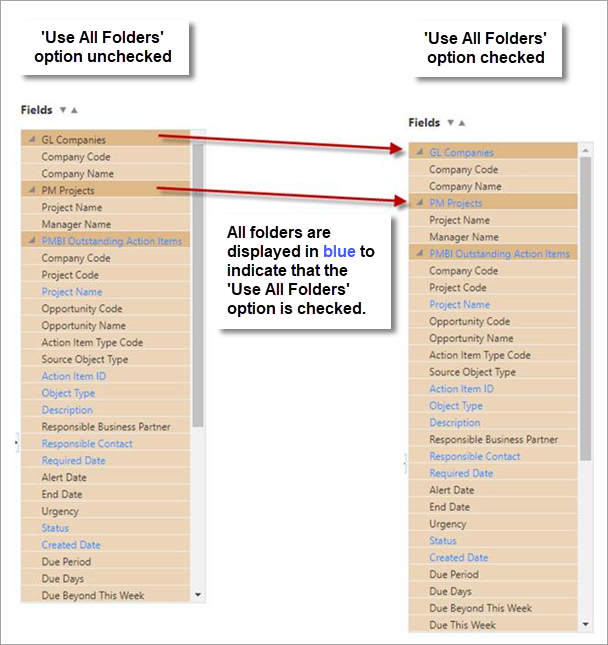
Use All Folders

When checked, this option allows dashboard developers to specify that all selected folders must always be used to query for data. All folders will be displayed in blue to indicate that the option has been checked, as shown in the screenshot below.
NOTE: This option is not available at runtime.
When this box is unchecked, if a folder is selected but its fields are not used in a visualization (or all its fields are removed by end users at runtime), then this folder will not be used in the query, potentially resulting in a different data set.
In some cases, dashboard developers may need their visualizations to always use all selected folders, even if no fields are actually used.
An example of such a case would be for JC Jobs security. The JC Jobs folder includes job security functionality. This folder will only return jobs that the current user has access to, while other folders may return all data regardless of job security.
In order to apply job security to other folders in the visualizations, dashboard developers need to include the JC Jobs folder and have the ‘Use All Folders’ box checked. This way, the JC Jobs folder will always be included in the query, limiting the data being displayed to only those jobs to which the current user has access. If the ‘Use All Folders’ box is unchecked, the JC Jobs folder won’t be used if its fields are not used in the visualization or if end users remove its fields at runtime.