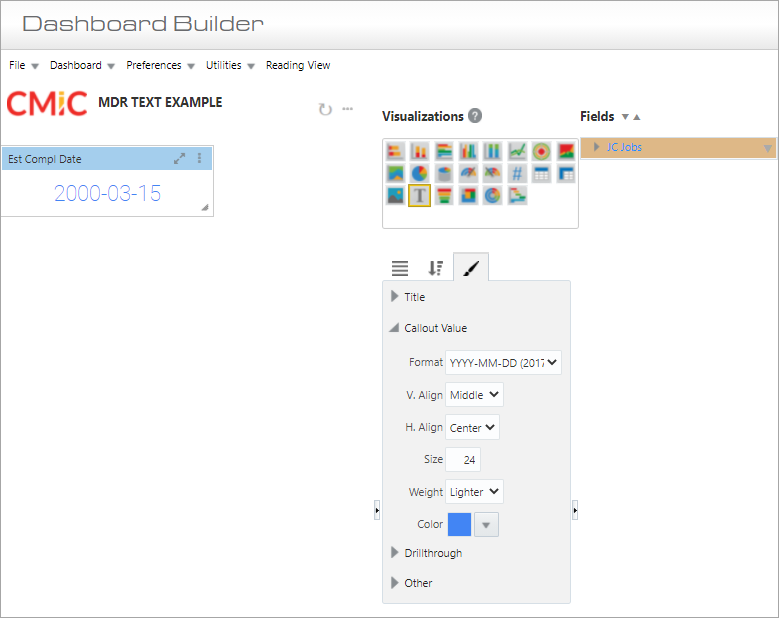
Example of Text Visualization
Part 1: Plotting Fields
Value
This plotting field is used to set the text to be displayed in the visualization, which is a single non-aggregated value from the database. To set the text, drag the relevant field from the Fields pane. All data types are supported. An alternate format for number and date can be specified on the text visualization’s Format tab.
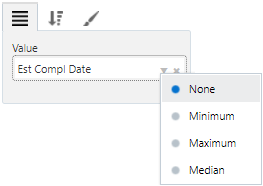
When multiple database records are found, the following message will be displayed: “Single Record Required”. For String or URL data types, a down-arrow ( ) is available to select a single text value by its position when sorted alphabetically (dictionary order). Options available include “None”, “Minimum”, “Maximum”, and "Median".
If no database record is found, the following message will be displayed: “No data to display”.
Part 2: Sort & Filter

For details about filtering the data used by the text visualization, please refer to Sort and Filter – Tab.
Part 3: Format
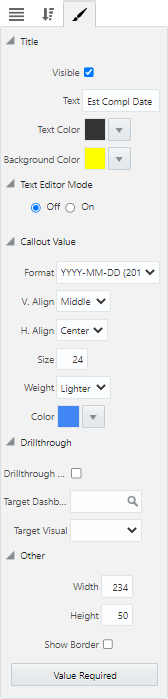
Title
Visible – Checkbox: Used to show/hide the title.
Text: Used to set the title for the visualization, which is displayed along its header.
Text Color : Used to set the text color of the visualization's title.
Background Color: Used to set the background color of the title.
Text Editor Mode
This property is used to add free format text. The feature is turned on and off using the radio buttons. Selecting the 'On' radio button launches the Text Editor window, used for entering and editing text, or for inserting HTML text elements.
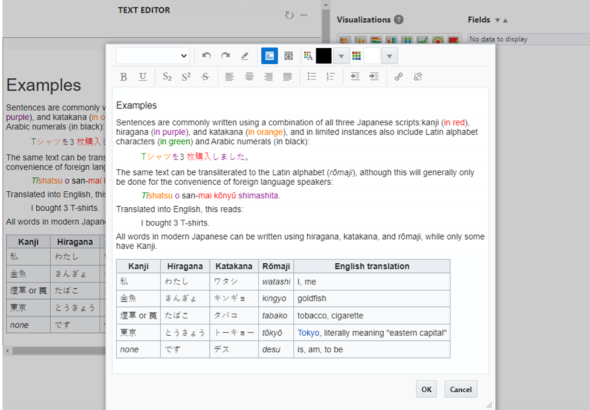
Example of Text Editor in Text Visualization in BI Dashboard Builder
Callout Value
Format: Used to specify format of the value.
V. Align: Used to set the vertical alignment of the text. Options available are “Top”, “Middle”, or “Bottom”. When the number of characters exceeds the visualization’s available space, a vertical scrollbar is displayed. The scrollbar only appears when the V. Align property is set to “Top”. The text is clipped for all other V. Align options.
H. Align: Used to set the horizontal alignment of the text. Options available are “Left”, “Center”, or “Right”.
Size: Used to set the font size of the text.
Weight: Used to set the font weight of the text. Options available are “Lighter”, “Normal”, and “Bold”.
Color: Used to set the color of the text using a pop-up color selector.
Drillthrough
Drillthrough Filter – Checkbox: Check to pass the current value to the target dashboard.
Target Dashboard: Used to specify a drillthrough target to a dashboard.
Target Visual: Used to specify a drillthrough target to specific visual on a dashboard (when a target dashboard has been selected in the Target Dashboard field above).
Other
Width: Shows the width of the visualization (editable to allow the user to adjust width).
Height: Shows the height of the visualization (editable to allow the user to adjust height).
Show Border – Checkbox: Check to apply border to visualization.
[Value Required] - Button
This button is used to launch the Value Required pop-up window, where available dashboard filters/substitution variables are listed. Refer to Value Required for more information.