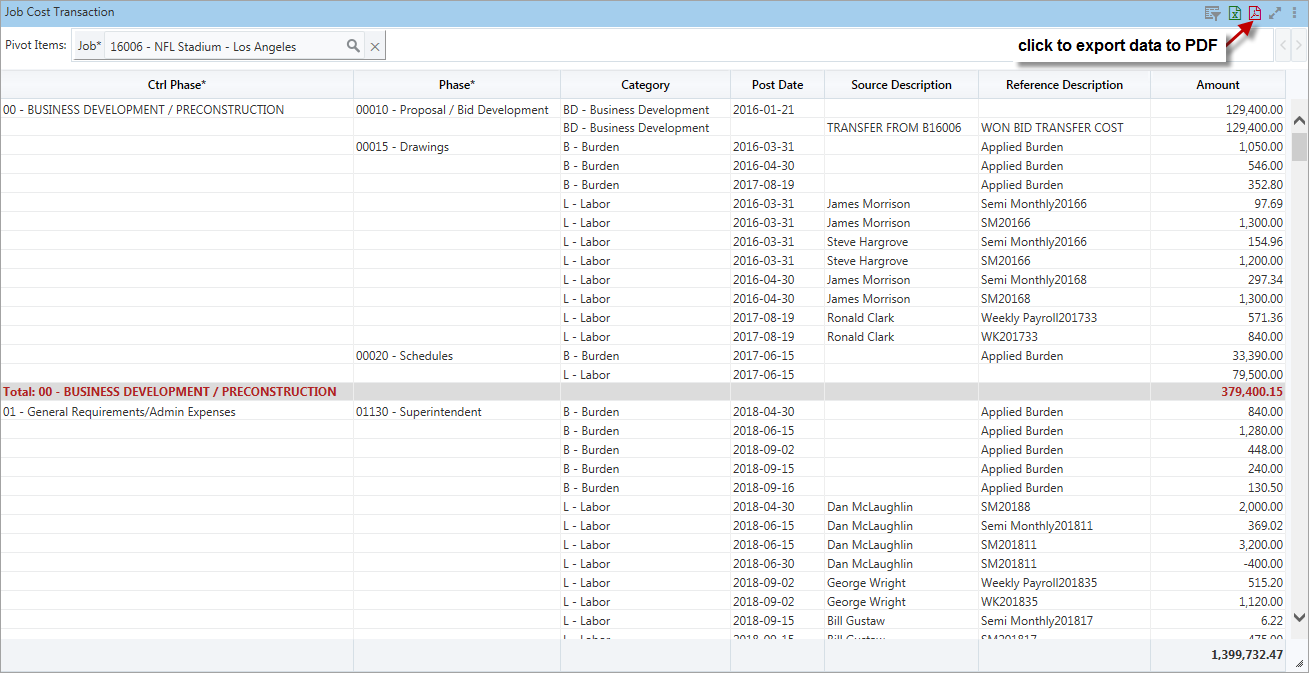
As shown above, a PDF icon is available on the top-right of a table’s header to export the table’s data to a PDF file.
Below is a screenshot of the above table’s exported data in a PDF file:

The following options are available for the Export to PDF functionality on the Format tab of the Visualization Properties control, as shown below. They are used to set the PDF’s page orientation and size, to upload a logo, and to specify subtitle and footer text for the PDF.
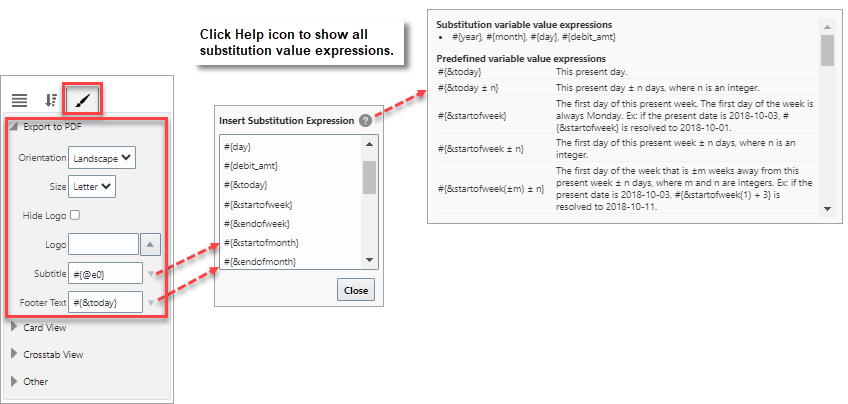
Example of the export to PDF functionality on the Format tab of the Table Visualization Properties control
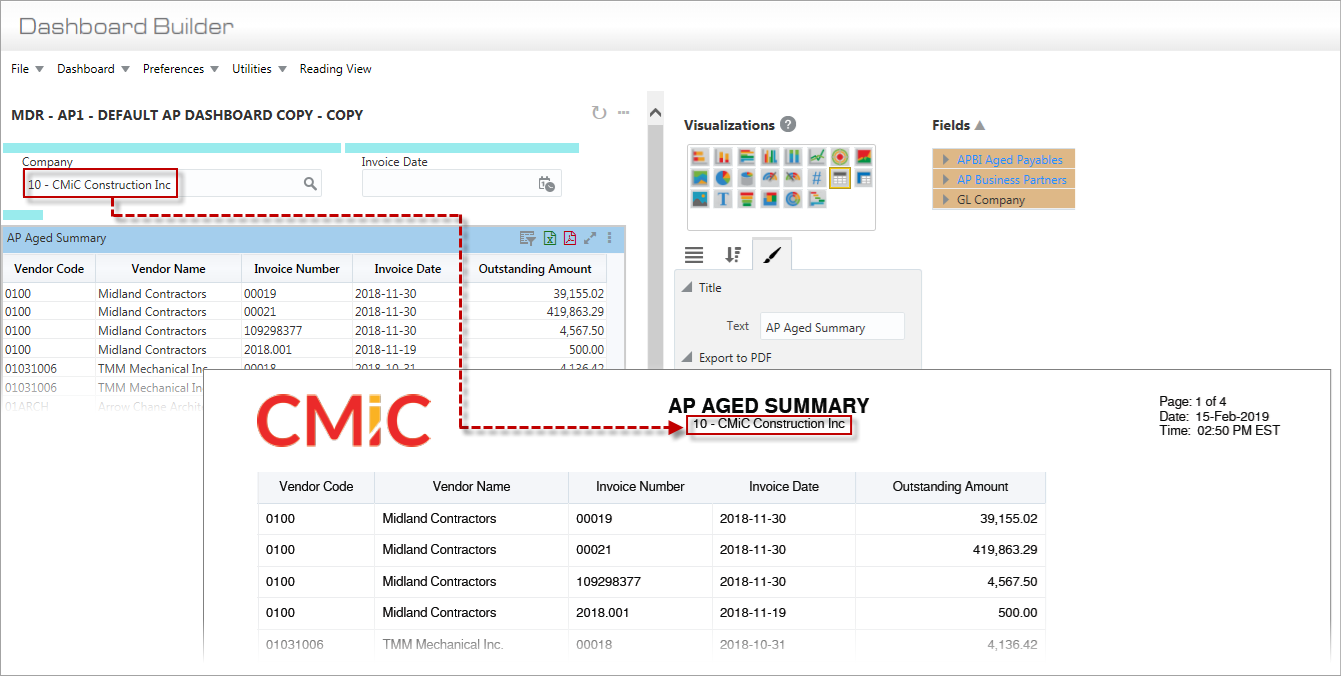
As shown in the above screenshot, a logo can be displayed in the upper left corner of the exported PDF. If the Logo property is left empty on Format tab of the Visualization Properties control, the logo defaults from the Dashboard Logo Image Path field on the Logo Path tab of the System Options screen (standard path: System > Setup > System Options – Logo Path tab), as shown below.
NOTE: The URL to the image must be publicly accessible (no authentication) and start with https. The following image formats are supported: JPG, BMP, GIF, WBMP, and PNG. If the image is not supported (not shown) in the table PDF export, please use the PNG format.

Otherwise, the user can upload a substitute logo in the Logo property on the Format tab of the Visualization Properties control which will display on the PDF instead. To clear a substitute logo from the Logo property on the Format tab, use the Delete or Backspace keyboard key.
Custom subtitle and footer text may contain any of the available substitution value expressions. Click on the arrow next to the Subtitle or Footer Text fields in the Format tab to launch a pop-up window where substitution values can be selected. Click on the help icon in the pop-up window to show all substitution value expressions, including substitution variable value expressions, filter value expressions, and pre-defined variable value expressions.
For a list of available pre-defined substitution value expressions, please refer to the table in the following

The format for a page filter value expression is: #{@visualizationId}. The visualization Id can be obtained from the page filter’s About menu option (e.g. #{@e0}), as shown in the screenshot above.
An example of the resulting exported PDF is shown in the screenshot below.
Notes for Exporting Data to PDF
The following items are exported from a table to a PDF file:
-
Column sorts (ascending/descending)
-
Group Sorts
-
Group Sort Lines, including color & thickness
-
Subtotals, including font & background color
-
Grand totals
Latest data is exported, and latest page filter values are applied.
URLs in columns become hyperlinks  in PDF.
When necessary, an export is queued, with a message stating position in queue as follows, "Please Wait. You are currently in position X."
Maximum amount of time a PDF export can run to completion is 5 minutes; after 5 minutes, a timeout message is displayed, asking the user to narrow the data selection; an incomplete PDF file is still downloaded, with the prefix "Incomplete".
Characters from most writing systems (languages) are supported; if unknown characters are found during the export process, the unknown characters are replaced with the character .
.
NOTE: The Autoload Data option must be enabled before exporting a dashboard or query to PDF, otherwise data may not be exported properly. Refer to Dashboard Runtime Controls for more information about the Autoload Data option.