Runtime Toolbar – Controls
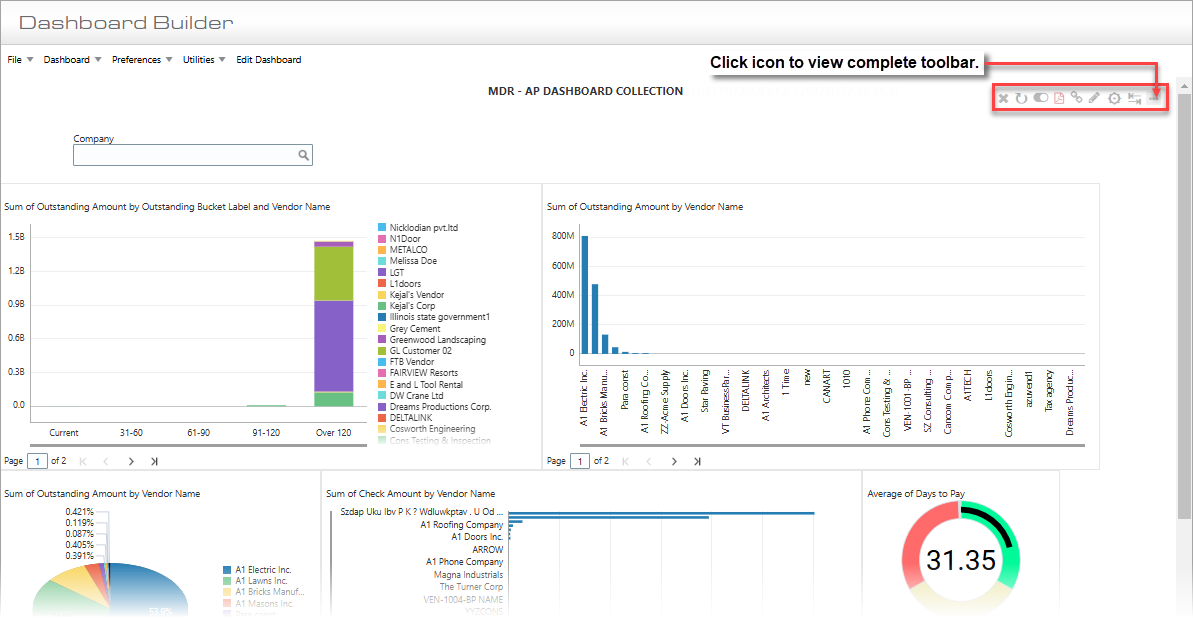
Example of dashboard at runtime for end-users, with the Dashboard Runtime Controls framed in red
The following dashboard controls are applicable to end-users at runtime. User must click on the Ellipses icon ( ) to view complete toolbar.
This control is used to clear all filters with a single click. When any filter on a query or dashboard has values applied, the Clear Filters icon ( ) will appear in the Runtime toolbar. To reset all filters, simply click the icon. This will instantly delete all applied filters and reset them to blank, giving you a clean slate to customize your filters again as needed. It’s particularly helpful for users who frequently adjust filters or need to reset dashboards quickly for new analyses.

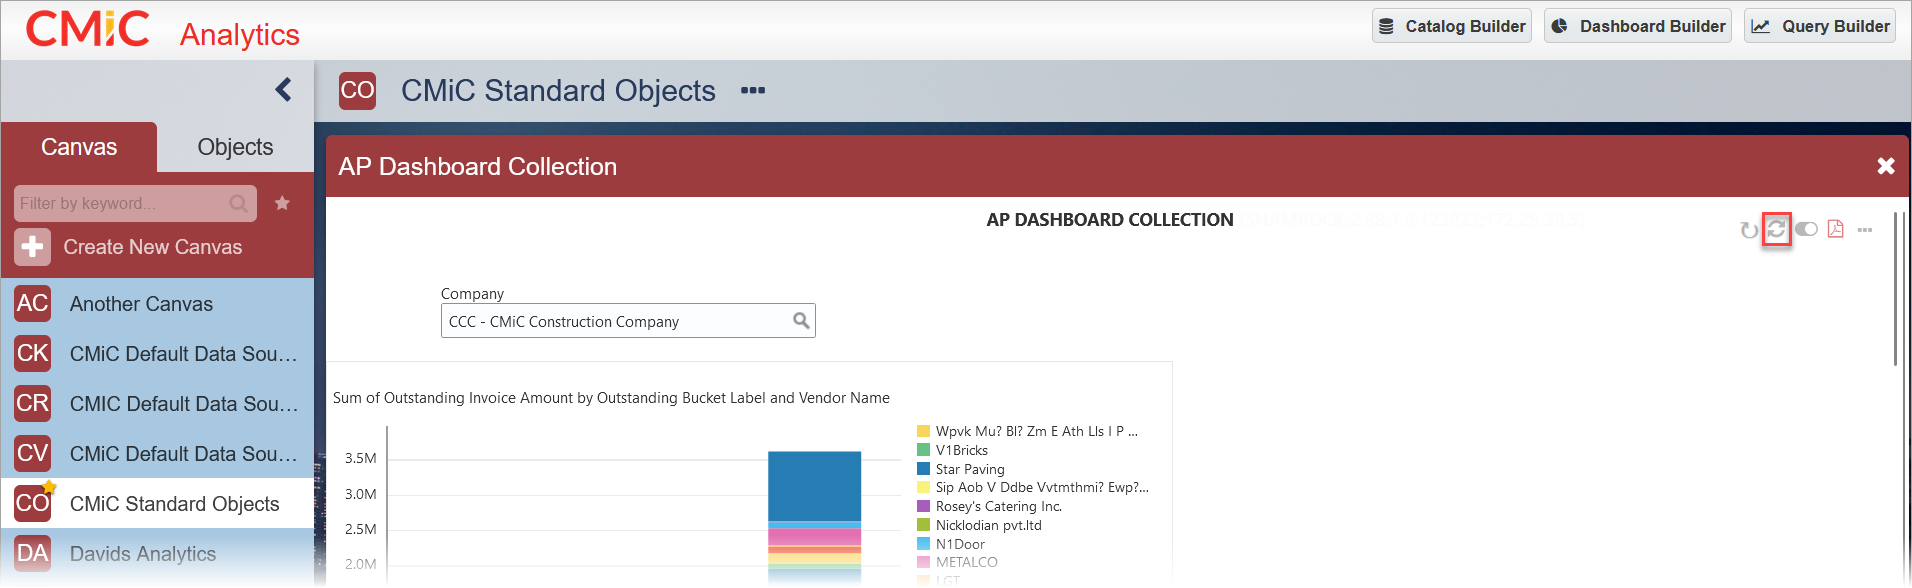
This control is used to refresh a dashboard’s visualizations using current data from the database.

When engaging with a dashboard or query in the BI Analytics tool, users have the flexibility to rearrange objects, modify column sequences, adjust sort orders, and more. Should the need arise to revert these modifications, the Discard Changes icon provides a straightforward solution. By clicking this icon, the query or dashboard will automatically revert to its last saved state.
NOTE: This control is only available in BI Analytics.

This control is for users who do not have access to BI Query Builder/BI Dashboard Builder and are experiencing timeouts. It allows them to turn Autoload Data off, then edit their filter selections without opening BI Query Builder/BI Dashboard Builder.
NOTE: The Autoload Data toggle must be enabled before exporting a dashboard or query to Excel, otherwise data may not be exported properly.

This control is used to export dashboards to PDF. Clicking the PDF icon will automatically start the download of the PDF file.

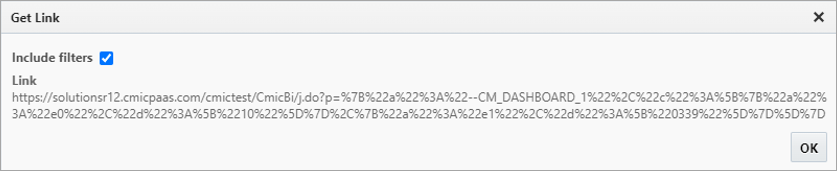
This option launches a pop-up which displays the URL for the dashboard, which can be right-clicked and copied using the context menu that appears. The 'Include filters' checkbox is used to control whether filters are included in the link. If checked, then the URL will be updated accordingly so if the link is copied and shared, it will contain the pre-defined filters.

At runtime, this control is available to end-users with the BIDBRDEDIT system privilege in order to edit dashboards via BI Dashboard Builder.

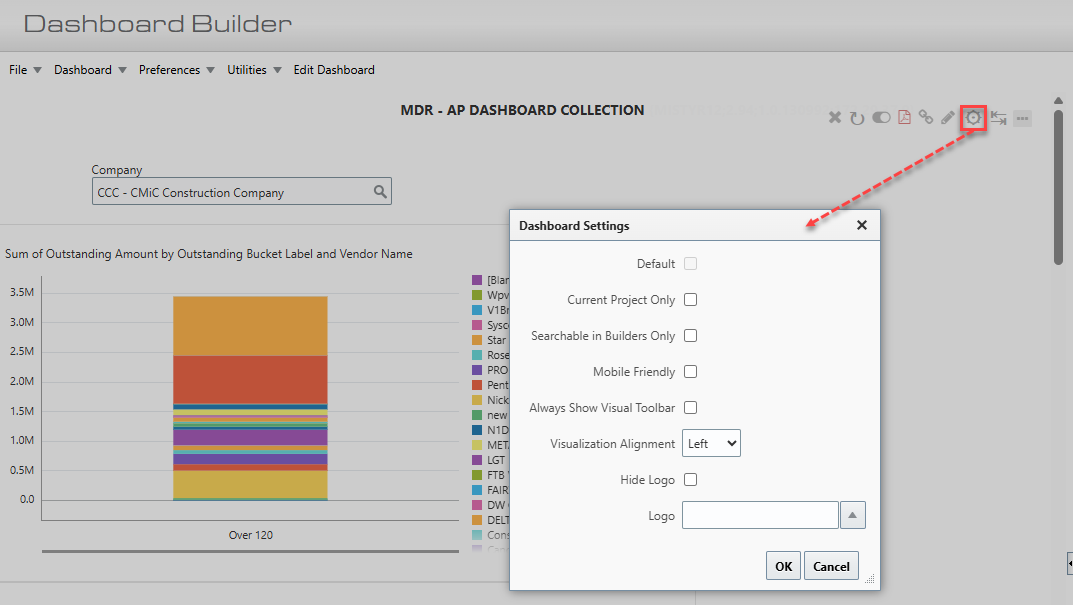
Pop-up window launched from Dashboard Settings icon in Dashboard Runtime Controls toolbar
Default – Checkbox
This setting helps users identify whether a dashboard is considered a standard dashboard for all users as part of the CMiC Default Data Source. When this box is checked, users cannot save changes directly to the query or dashboard and must instead use the “Save As” option.
Current Project Only – Checkbox
If ‘Current Project Only’ box is checked, the dashboard’s visualizations using folders that are current-project sensitive will only use data from the user’s current default project, as set in CMiC Field.
This option is applicable to:
-
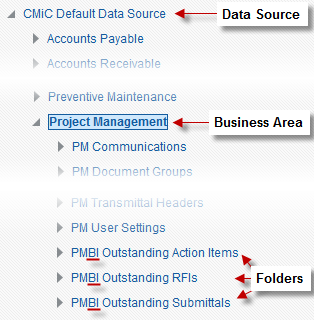
Visualizations using data from folders of the advanced analytics type that are current-project sensitive (i.e., capable of returning data only for user’s current default project). Folders of the advanced analytics type are identified in BI Catalog Builder by the “PMBI” suffix in a folder’s name, as shown below:
BI Catalog Builder – Edit Data Sources
-
Visualizations using data from the PM Projects folder, or any user-created folder that references the DA.PMPROJECT_V view:
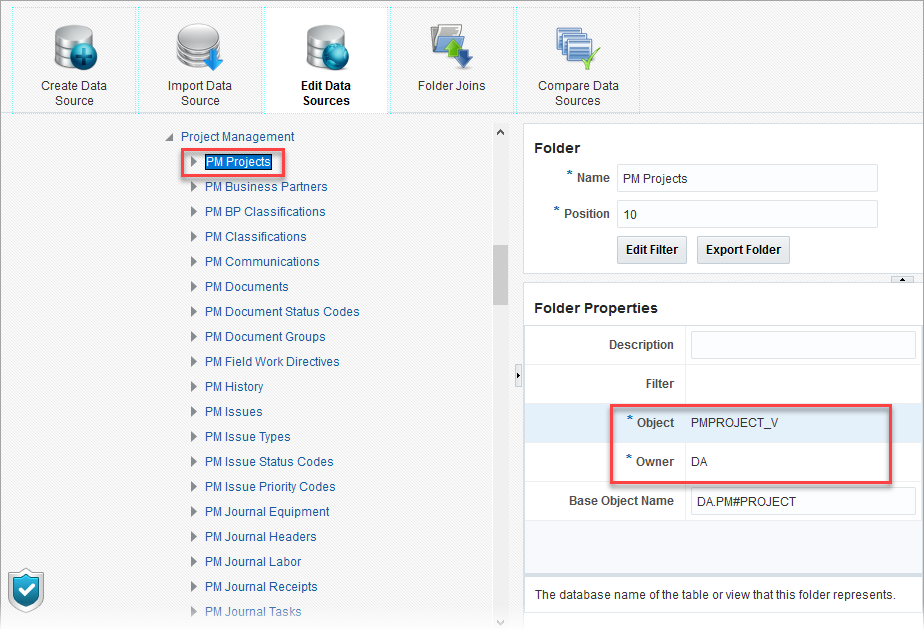
BI Catalog Builder – Edit Data Sources
NOTE: For this option, the ‘Use All Folders’ checkbox must also be checked in the visualization’s Fields pane in BI Dashboard Builder. Refer to Use All Folders for more information.
-
Visualizations using data from the PMBI Current Project folder or any user-created folder that references the CMIC_BI.PM_PROJECT view:
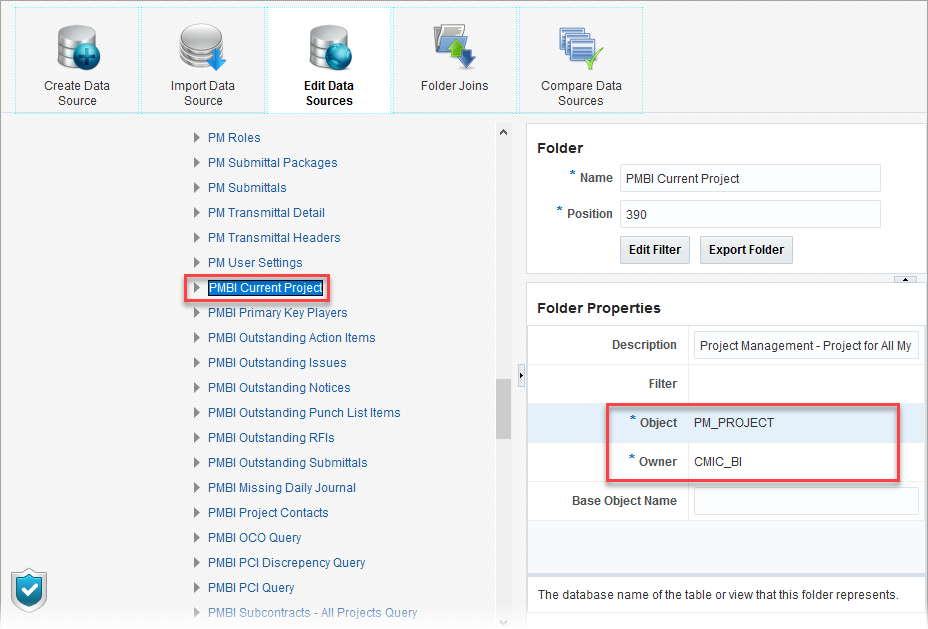
BI Catalog Builder – Edit Data Sources
NOTE: For this option, the ‘Use All Folders’ checkbox must also be checked in the visualization’s Fields pane in BI Dashboard Builder. Refer to Use All Folders for more information.
If the ‘Current Project Only’ checkbox option is required for visualizations using any other folder, BI Catalog Builder needs to be used to create a join between that folder and the PM Projects or PMBI Current Project folder, or between that folder and a user-created folder that references the DA.PMPROJECT_V or CMIC_BI.PM_PROJECT view.
Searchable in Builders Only – Checkbox
When this setting is checked, the dashboard is searchable in BI Dashboard/BI Query Builder only. It is not searchable in Analytics or Web services. This setting allows the user to hide a dashboard (e.g., drill-down dashboards, deep linking dashboards, etc.) that’s not relevant to the search in Analytics or Web services.
Mobile Friendly – Checkbox
This property is used to apply a mobile-friendly setting to the dashboard. A dashboard designer can check this setting to indicate that the dashboard is mobile friendly. The width of each visualization will not be wider than the screen width.
Always Show Visual Toolbar – Checkbox
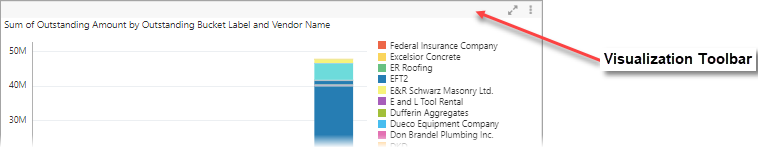
This property is used to control whether a visualization's toolbar remains visible. By default, a visualization's toolbar is only shown when the mouse pointer is hovered on it or when the visualization is selected. When this box is checked, the toolbar of each visualization on a dashboard will always be displayed.
Visualization Alignment
This property is used to left-align, right-align, or center visualizations on a dashboard. The drop-down menu contains options for "Left", "Center", and Right". Depending on your selection, visualizations will be aligned accordingly on the screen.
Hide Logo – Checkbox
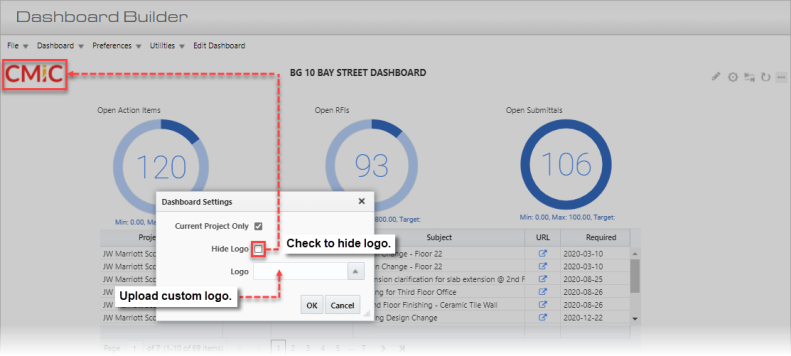
Use the ‘Hide Logo’ checkbox in the Dashboard Settings pop-up window to hide the logo displayed on the dashboard.
Logo
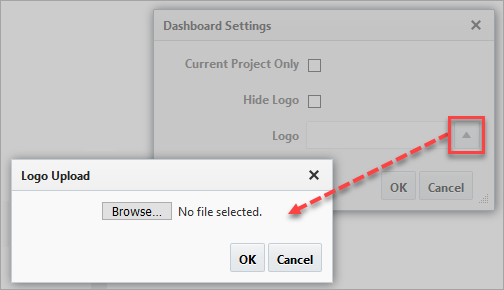
This property allows the user to upload and display a custom logo. If the Logo property is left empty, the logo defaults from the Dashboard Logo Image Path field on the Logo Path tab of the System Options screen (standard Treeview path: System > Setup > System Options – Logo Path tab).
Show/Hide Visualization Settings 
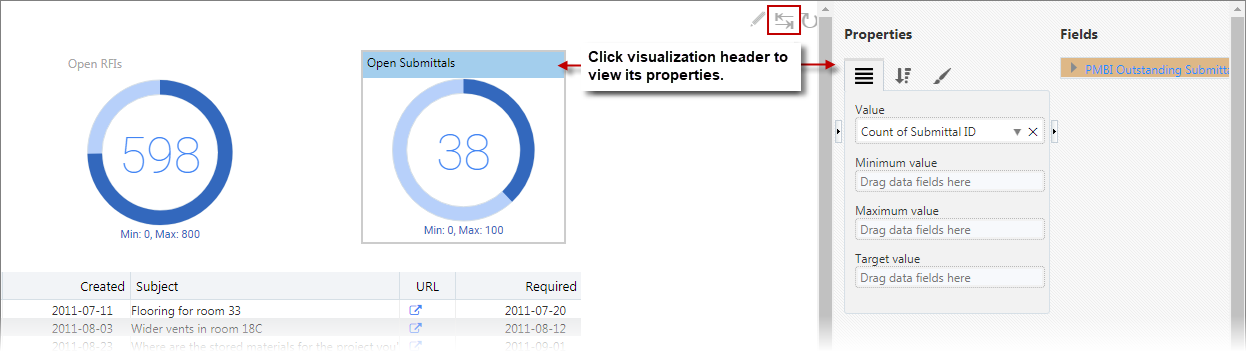
This control is used to edit a visualization’s settings during runtime. To do so, select a visualization by clicking its header, then click this control to reveal the Visualization Properties control for the selected visualization.
This functionality allows end-users to temporarily (no changes are saved) modify a visualization’s properties, such as changing how its data is filtered and sorted.