Why is it Useful?
CMiC has added a new performance analysis feature, which allows users to analyze the load time of specific visualizations on their BI reports. Designing dashboards that load quickly can be challenging, especially when trying to display hundreds or thousands of data points. The performance analysis helps users narrow down the visualizations that take long to load. It also shows the folders and calculated fields that are employed by each visualization.
NOTE: This feature was released in Patch 17.
How Does it Work?
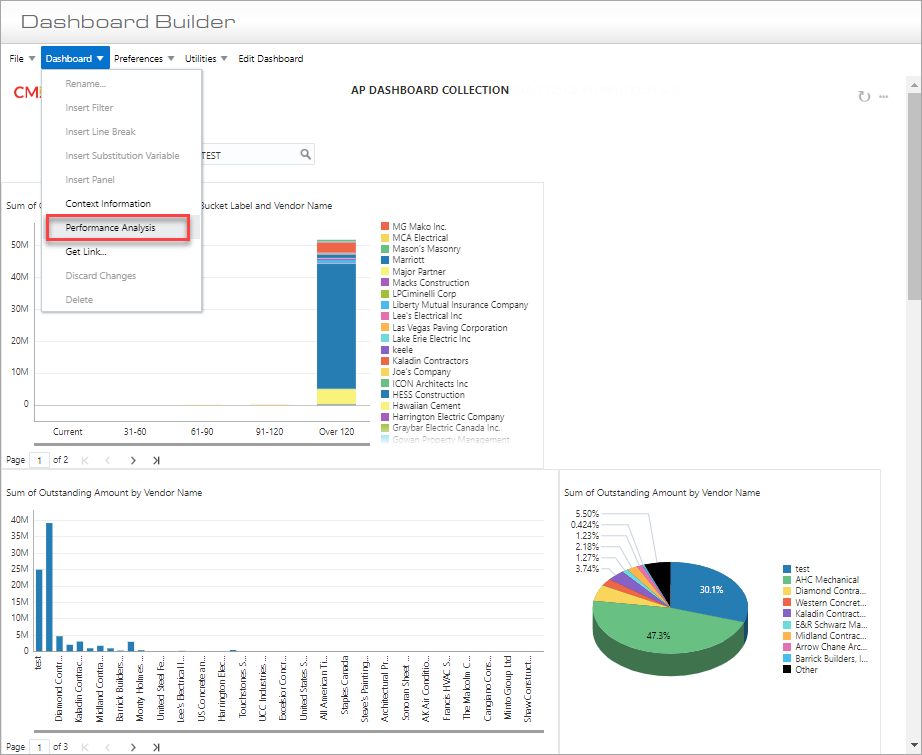
Dashboard drop-down menu
In the BI Dashboard Builder tool's Dashboard menu, select the "Performance Analysis" option from the drop-down menu.
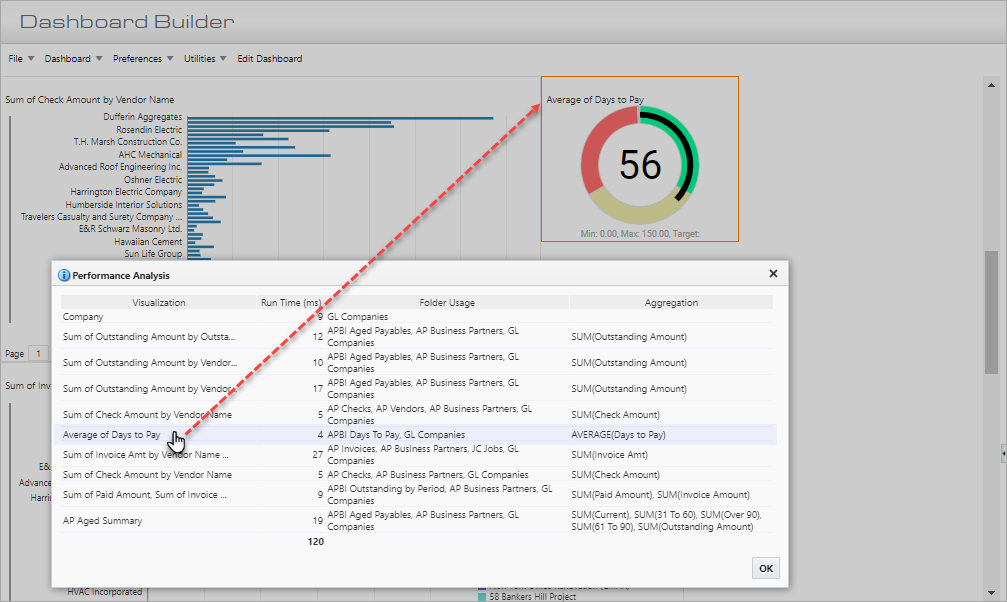
Pop-up launched from Performance Analysis option
Selecting the "Performance Analysis" option launches a pop-up window which summarizes the performance of the dashboard. Each row in the pop-up window represents a visualization. Hovering your mouse over an individual row will highlight the corresponding visualization with an outline in the dashboard.
For more information on improving the performance of your BI reports, refer to BI Dashboard Builder - Designing Fast BI Reports.
To learn more about some of the latest features released in this patch, return to Patch 17 Highlights.