Why is it Useful?
CMiC has added more flexibility when aligning visualizations on a dashboard. Visualizations can now be left-aligned, right-aligned, or centered on a dashboard.
This enhancement gives users more control over the layout and formatting during dashboard design. For example, if center alignment is applied, users can count on visualizations being centered on the screen, no matter the size of the screen.
NOTE: This feature was released in Patch 17.
How Does it Work?
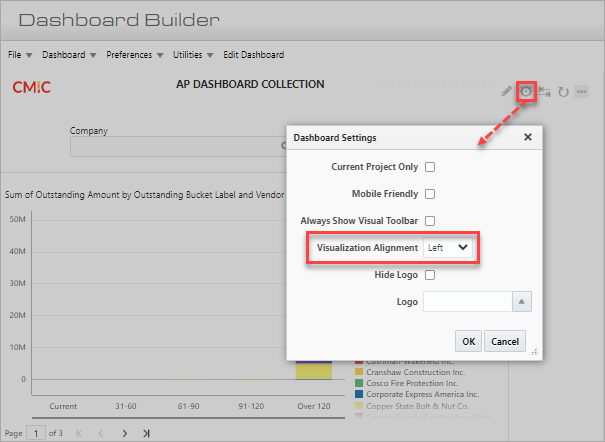
Pop-up window launched from Dashboard Settings icon in Dashboard Runtime Controls toolbar
In BI Dashboard Builder, click the Ellipses icon ( ) on the dashboard to view the Dashboard Runtime Controls toolbar. Once the complete toolbar is displayed, click on the Dashboard Settings icon (
 ) to launch a pop-up window where the Visualization Alignment field is located. The drop-down menu contains options for "Left", "Center", and Right". Depending on your selection, visualizations will be aligned accordingly on the screen.
For more information on using the dashboard settings, refer to BI Dashboard Builder - Dashboard Runtime Controls.
To learn more about some of the latest features released in this patch, return to Patch 17 Highlights.