Overview
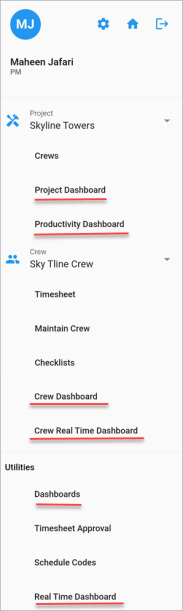
Dashboards in Construct CT Legacy can be launched from one of the dashboard links found in the main menu, shown above. These dashboards are a great tool for analyzing timesheet data and each one has been purposely designed so key elements can be examined at a glance.
-
The Project Dashboard displays timesheet summaries for the default project.
-
The Productivity Dashboard provides users with an overall review of crew productivity.
-
The Crew Dashboard displays timesheet summaries for the currently selected crew.
-
The Crew Real-Time Dashboard displays timesheet summaries for the currently selected crew in real time.
-
The Utility Dashboard displays timesheet summaries for all projects to which the user has access.
-
The Real-Time Dashboard displays the real-time activity of employees who are using the Construct CHK app to clock in/out and take breaks over the course of a shift on a job site.
Security
Access to the dashboards can be granted to a user's role in the Security Roles screen located in the E-Time module.
NOTE: The Security Roles screen launched from the E-Time module contains security options and settings that are not widely available in the security screens launched from other modules (e.g. CMiC Field, ESS, etc.). The dashboard programs being discussed here are only available for assignment in the Security Roles screen located in E-Time.
For convenience, the security for each of the dashboards listed below is highlighted in the screenshot.
-
Project Dashboard
-
Productivity Dashboard
-
Crew Dashboard
-
Crew Real-Time Dashboard
-
Utility Dashboard
-
Real-Time Dashboard
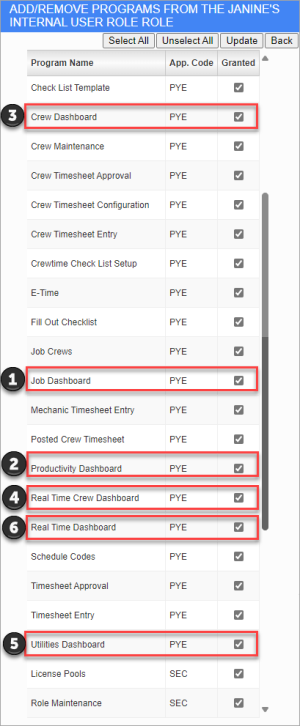
E-Time Security Roles; standard Treeview path: E-Time > Security > Role Maintenance
Project
Project Dashboard
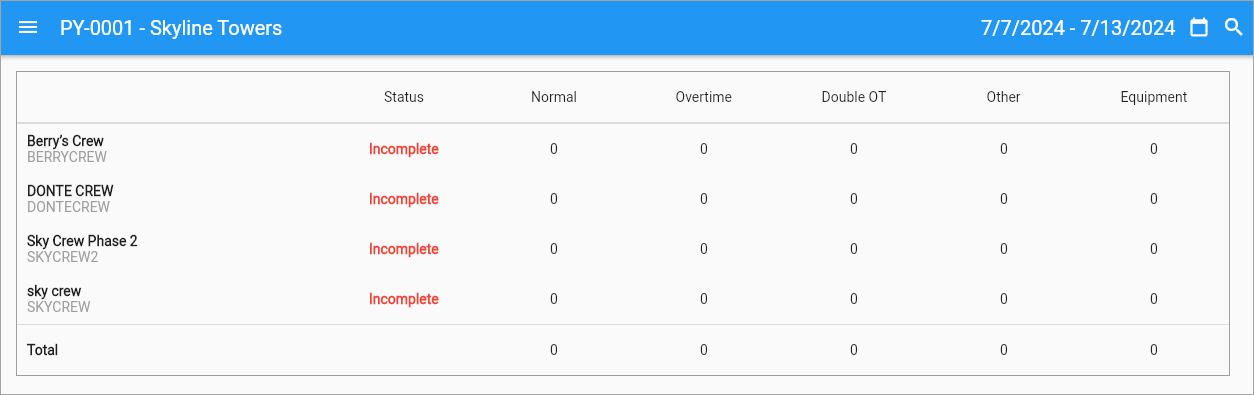
The Project Dashboard displays all crew timesheets related to the currently selected project. The current week is shown by default, but the date range can be changed by pressing the Calendar icon ( ).
).
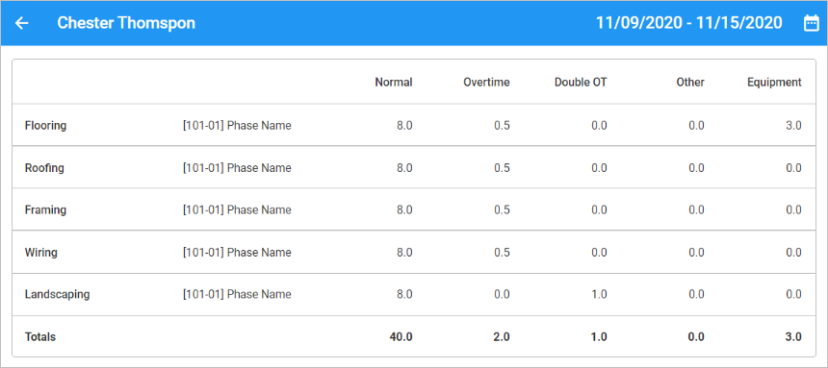
The dashboard displays totals for normal, overtime, double OT, other, and equipment hours for each crew working on the project for the selected week. The Status column indicates whether the timesheet is complete/incomplete. Press the crew code to drill down for further details on which crew members are missing timesheets for the selected period, as shown below. The Due column indicates whether the timesheet is complete or the number of days it is overdue/missing.
This dashboard can also be reached by pressing the Crew Dashboard option in the Construct CT Legacy menu.
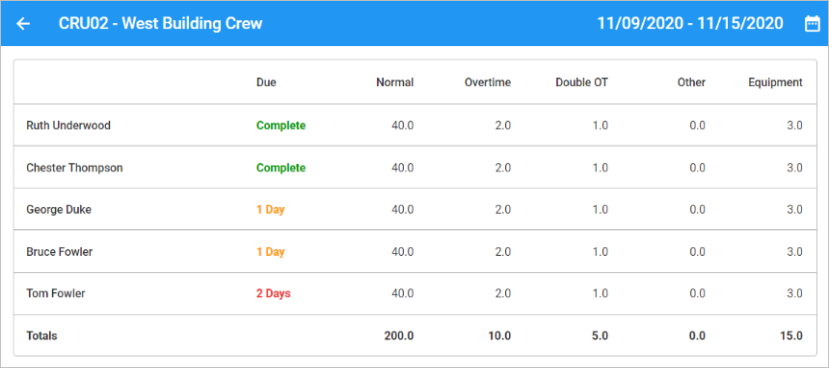
Press an employee row to see details for that employee.
Productivity Dashboard
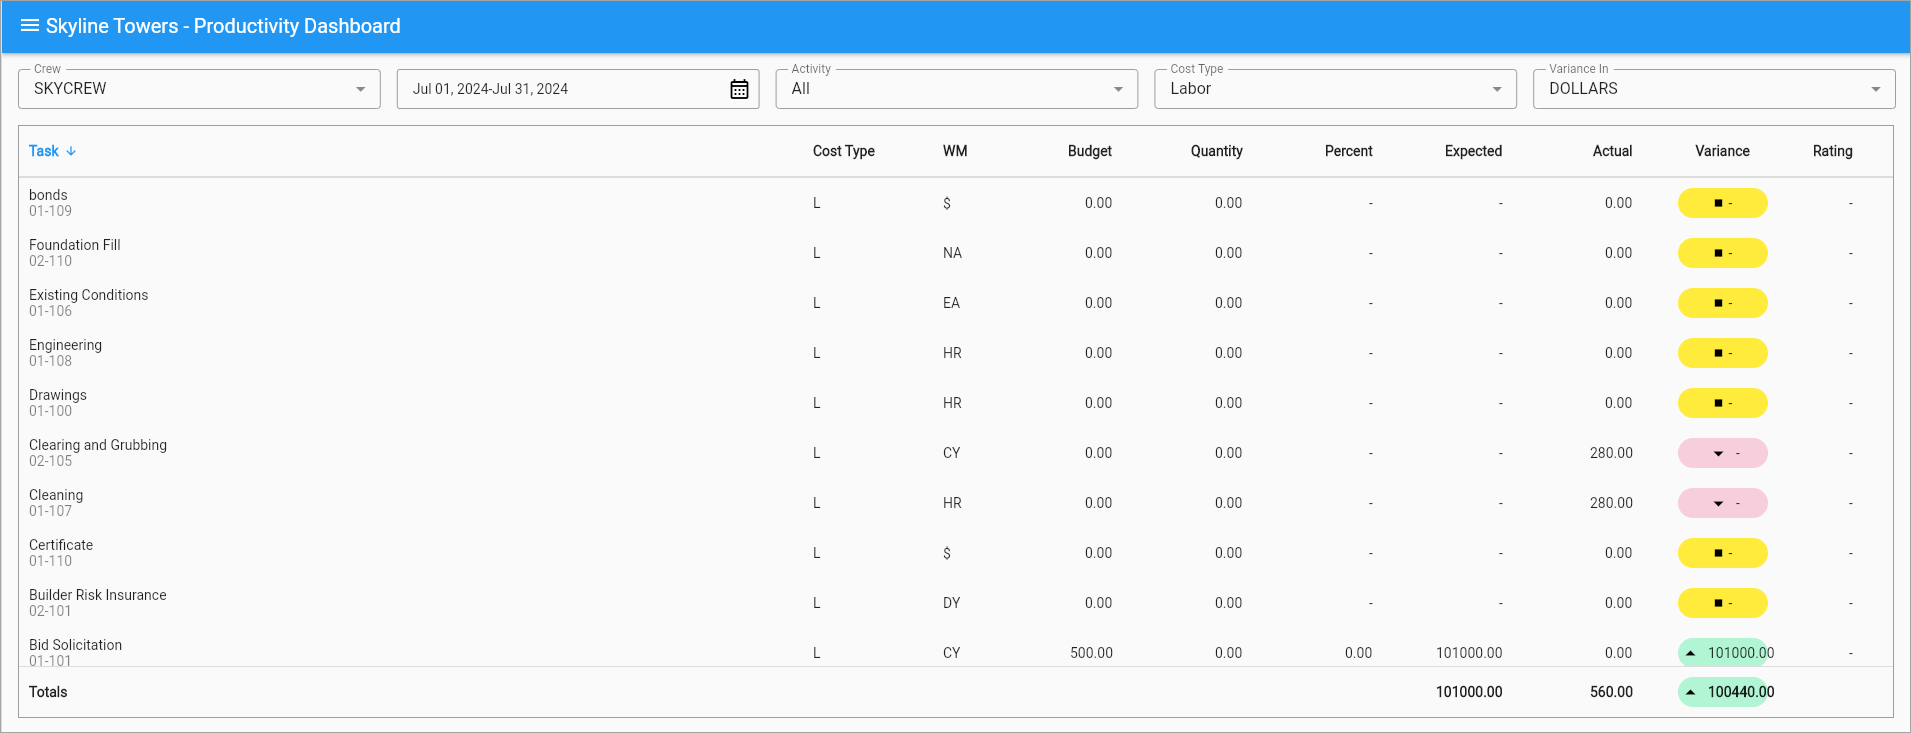
The Productivity Dashboard provides users with an overall review of crew productivity, including hour/cost/unit variances, ratings, and totals. Users can customize the dashboard by filtering the data by date, activity, cost type, and variance.
Selection Criteria
Crew
Select a crew from the Crew LOV, which includes all crews in the project. This field defaults to the crew selected in the Construct CT Legacy menu.
Date
Select a date or range of dates from the calendar. This field defaults to the current date. If a single date is selected, use the left and right arrows to navigate to the previous/next date.
Activity
Select one or more crew activities (tasks) from the LOV. This field defaults to "ALL".
Cost Type
Select whether to include labor, equipment, or all cost types. This field defaults to "Labor".
Variance In
Select whether to calculate the variance in dollars, dollars/units, hours, hours/units, units, units/hours.
Details
The Task, Cost Type, WM, and Budget columns reflect values set up in the Job Costing module.
The Quantity column represents the units entered on the crew sheet at the activity level, regardless of the cost type.
The Variance column is color-coded to reflect the variance between the expected and actual values, and is calculated as:
Variance = Expected Value - Actual Value
-
If the Expected Value > Actual Value, then the variance is positive and will be displayed in a green color with an upward arrow.
-
If the Expected Value < Actual Value, then the variance is negative and will be displayed in a red color with a downward arrow.
-
If the Expected Value = Actual Value, then the variance is 0 and will be displayed in a yellow color with a square.
Crew
Crew Dashboard

The Crew Dashboard will default to the currently selected crew in the Construct CT Legacy menu. The information would be the same as described above in Project Dashboard.
Crew Real-Time Dashboard
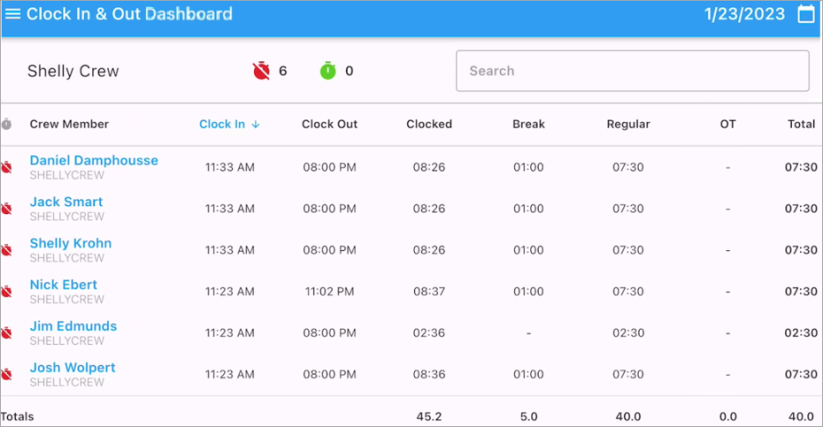
When accessing the Crew Real-Time Dashboard, the current crew selected in the Construct CT Legacy menu will be displayed by default. The information presented will be similar to the Crew Dashboard, in that all crew members will be listed, but the clock-in status for their shift will also be visible. The clock-in status is being captured in real-time for employees who are using the Construct CHK app to clock in/out and take breaks over the course of a shift on a job site.
Refer to Using the Real-Time Dashboard for more information about using real-time dashboard features.
Utility
Utility Dashboard
The Utility Dashboard displays timesheet summaries for all projects to which the user has access. The dashboard contains two tabs: My Jobs and My Responsible Persons.
My Jobs – Tab
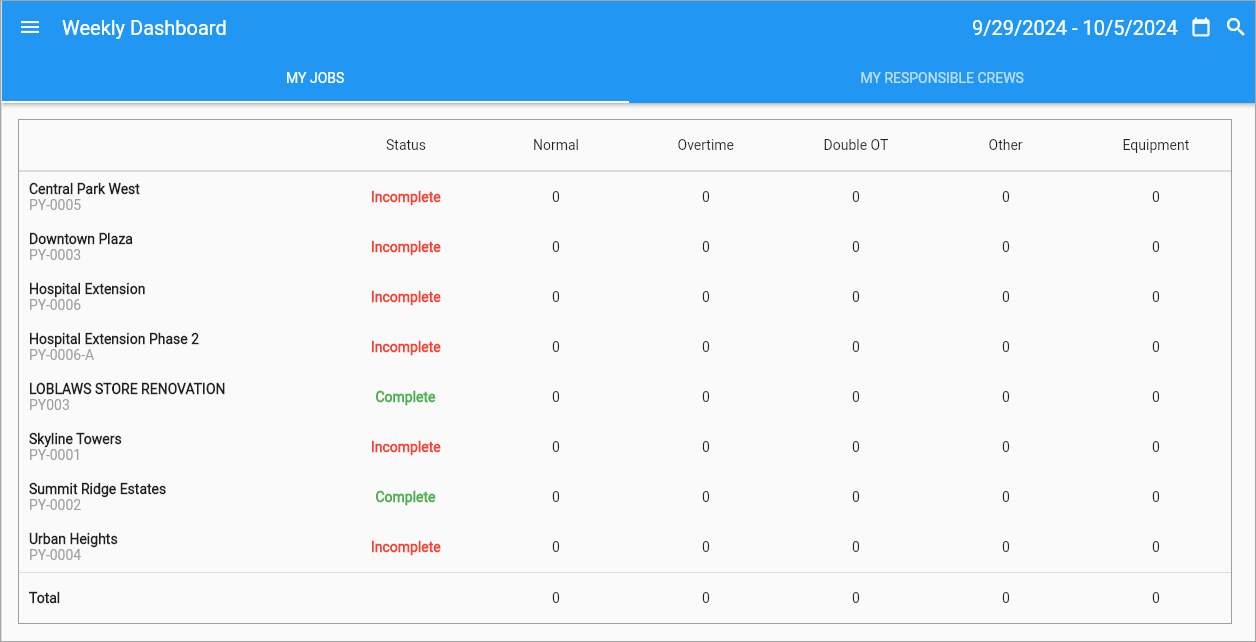
The My Jobs tab on the Weekly Dashboard screen displays the information for all jobs to which the user has access. The user can select a job to bring up the project dashboard for that job. Selecting a crew from this dashboard will then display the dashboard for that particular employee.
My Responsible Persons – Tab
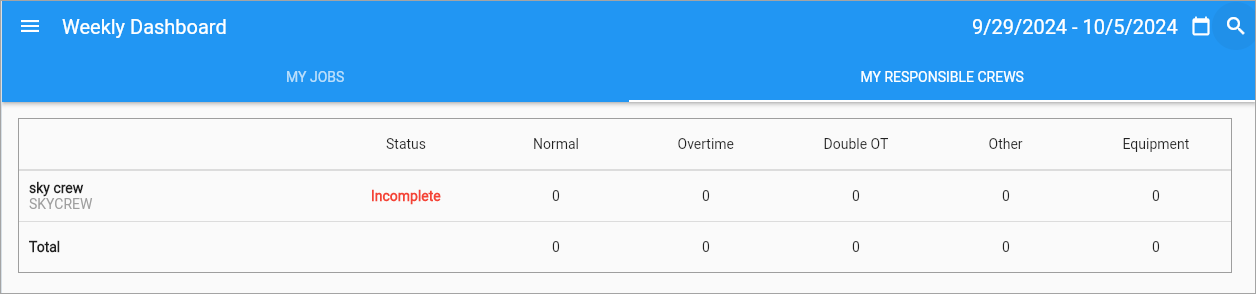
This tab shows all jobs for which the selected user is responsible. The responsible person can be changed in the Maintain Crew screen.
Real-Time Dashboard
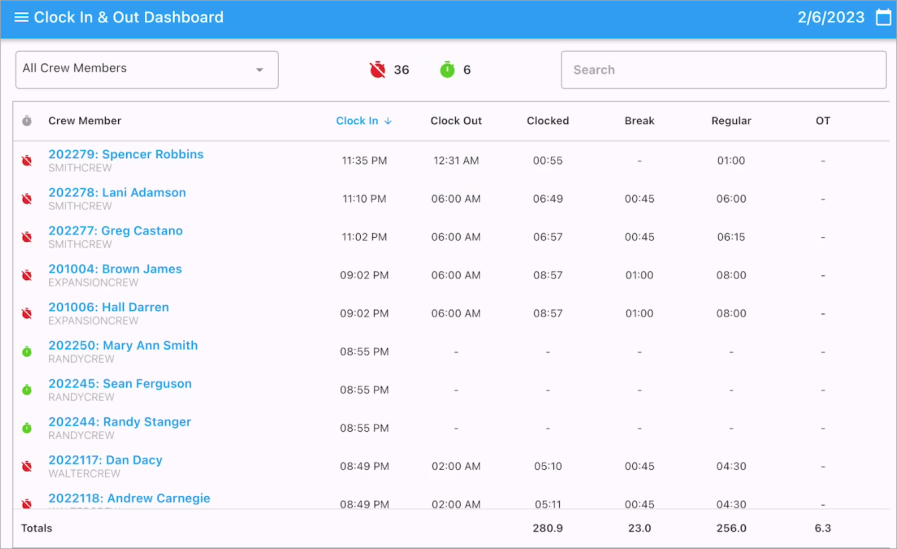
The Real-Time Dashboard captures the real-time activity of employees who are using the Construct CHK app to clock in/out and take breaks over the course of a shift on a job site.
To learn more about using this dashboard, refer to Using the Real-Time Dashboard.