Overview
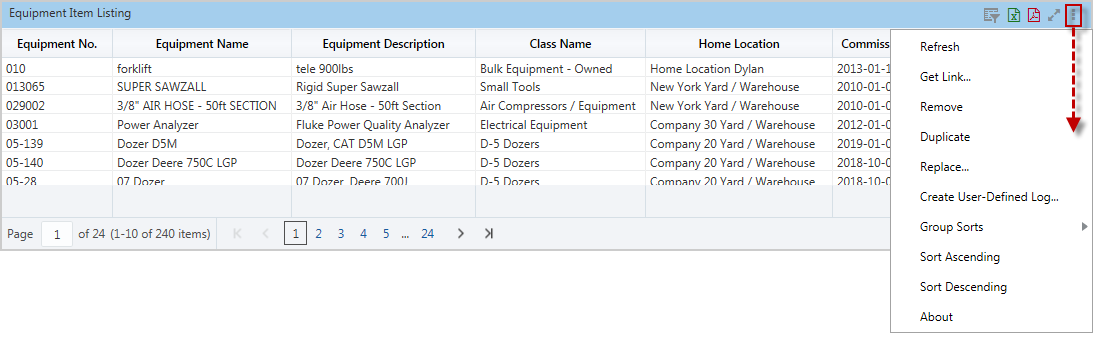
Each visualization has a Visualization Menu, which is revealed by clicking the Ellipsis icon, as shown above.
Refresh
Used to refresh the visualization, as opposed to the entire dashboard, based on the most recent data.
Get Link
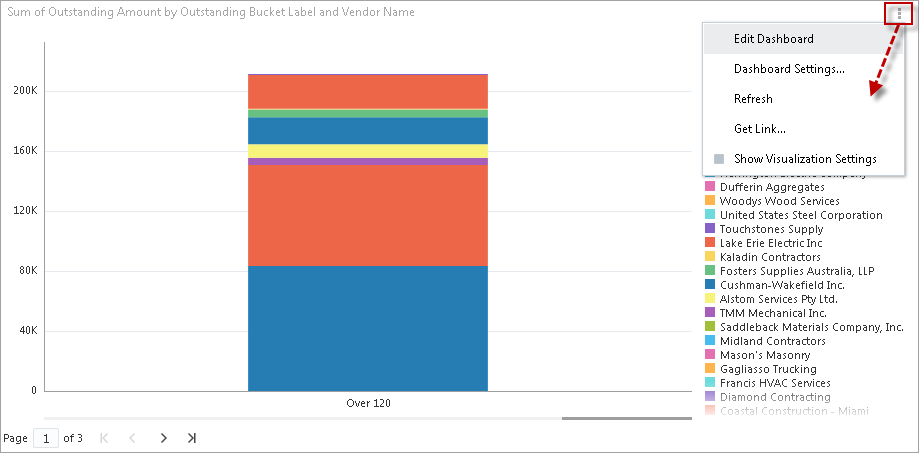
Used to get link to visualization, as opposed to link to entire dashboard. The link can be sent to someone to illustrate a communication, or it can be used to create a new Console tab or a new Treeview link to view the visualization in the same way dashboards are made accessible, as per the following: BI Dashboard Builder - Making Dashboards Accessible via Console.
The screenshot below shows an example of a link opened at the visualization level. The visualization menu is located in the top right-hand corner of the display.
Remove
This option allows users to delete a visualization using a mouse and clicking on “Remove” in the drop-down menu.
Duplicate
This option allows users to duplicate the currently selected visualization by clicking on “Duplicate” in the drop-down menu. A copy of the selected visualization will appear on the dashboard.
Replace
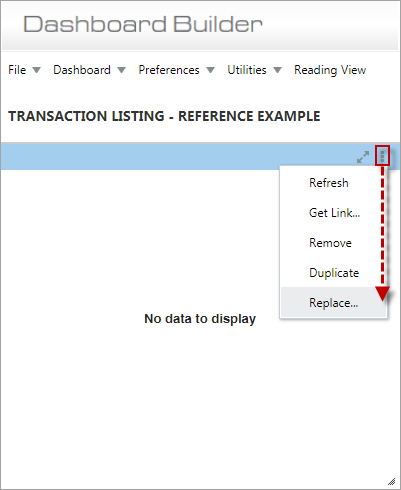
This option allows users to replace a visualization with a copy/reference visualization from another dashboard. Users can create a visualization on one dashboard and place it on other dashboards as a copy or reference visualization. A visualization can be copied/referenced multiple times.
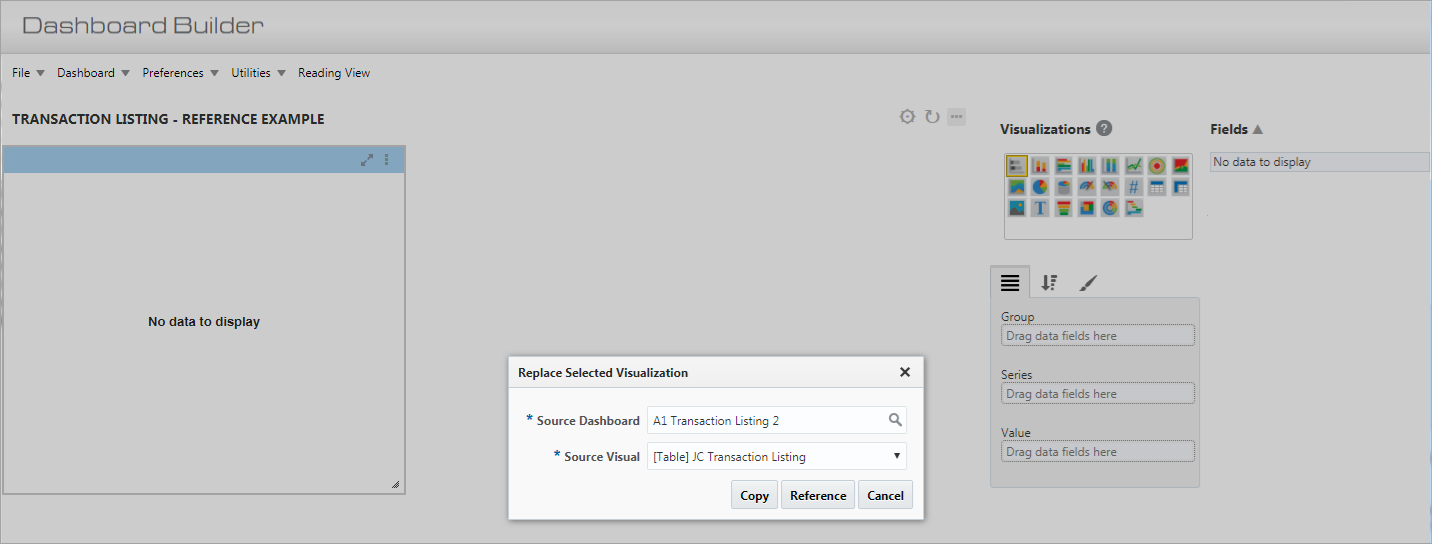
A reference visualization is always taken from the source visualization when the dashboard is open.
The copy or reference visualization behaves the same as any other visualizations on the dashboard that it is placed. This includes being filtered by the page filters, substitution variables, etc. The user can modify the copy visualization and changes can be saved. Saved changes to the copy visualization do not update the original source visualization in any way.
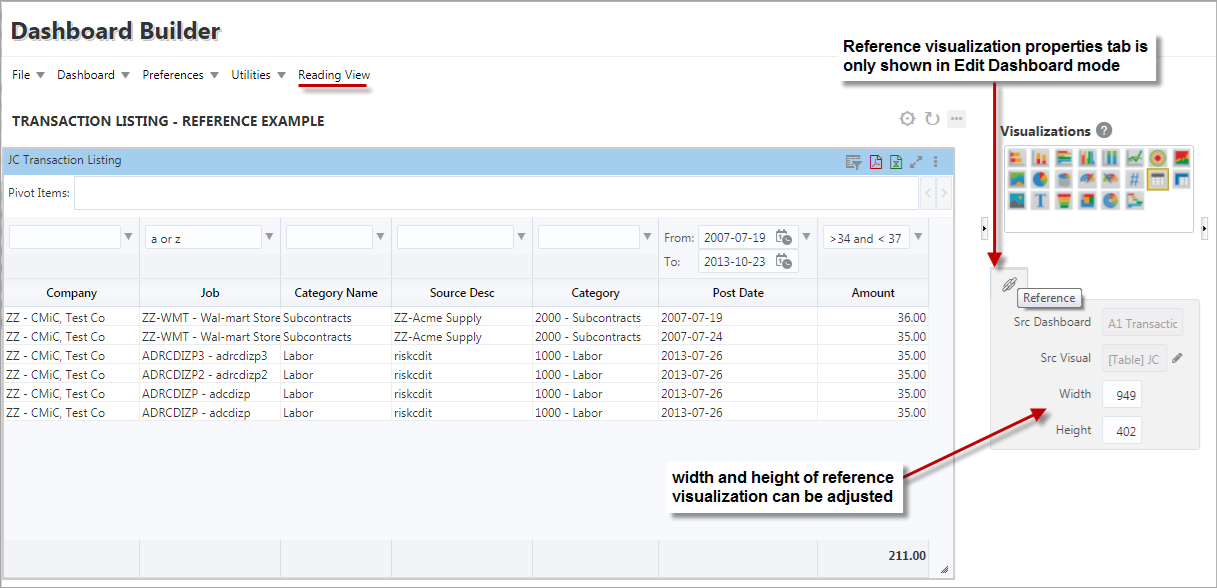
The Reference visualization properties tab is only shown in Edit Dashboard mode. The user can use this properties tab to adjust the reference visualization’s width and height.
In Reading View mode or during runtime, the end-user is not aware that the visualization is a reference visualization.
NOTE: The user may not reference a reference visualization.
Create User-Defined Log
This option is only available for tables, as per the following: Create User-Defined Log Based on Table.
Create User-Defined Folder
This option is only available for tables, as per the following: Create User-Defined Folder Based on Table.
Group Sorts
This option is only available for tables, as per the following: Remove Group Sorts (Keep Subtotals) and Remove All Group Sorts.
Sort Ascending
This option is only available for tables, as per the following: Sort Ascending.
Sort Descending
This option is only available for tables, as per the following: Sort Descending.
About
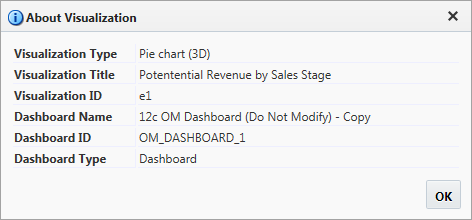
Pop-up window launched from About in the Visualization Menu
This pop-up window provides additional details about the selected visualization.