Overview
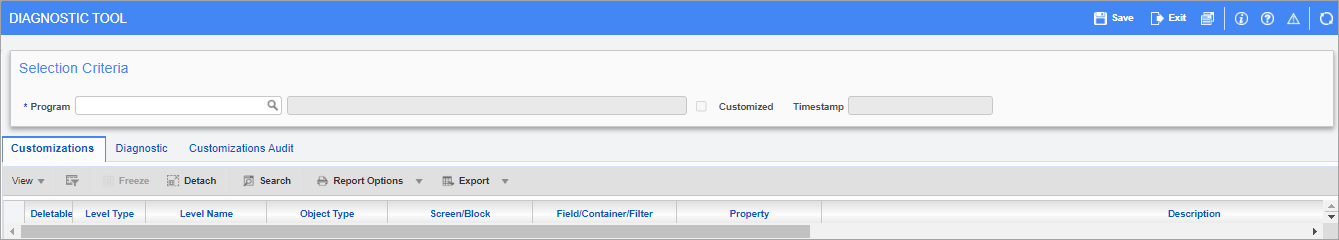
Pgm: DIAGNOSTIC_TOOL – Diagnostic Tool
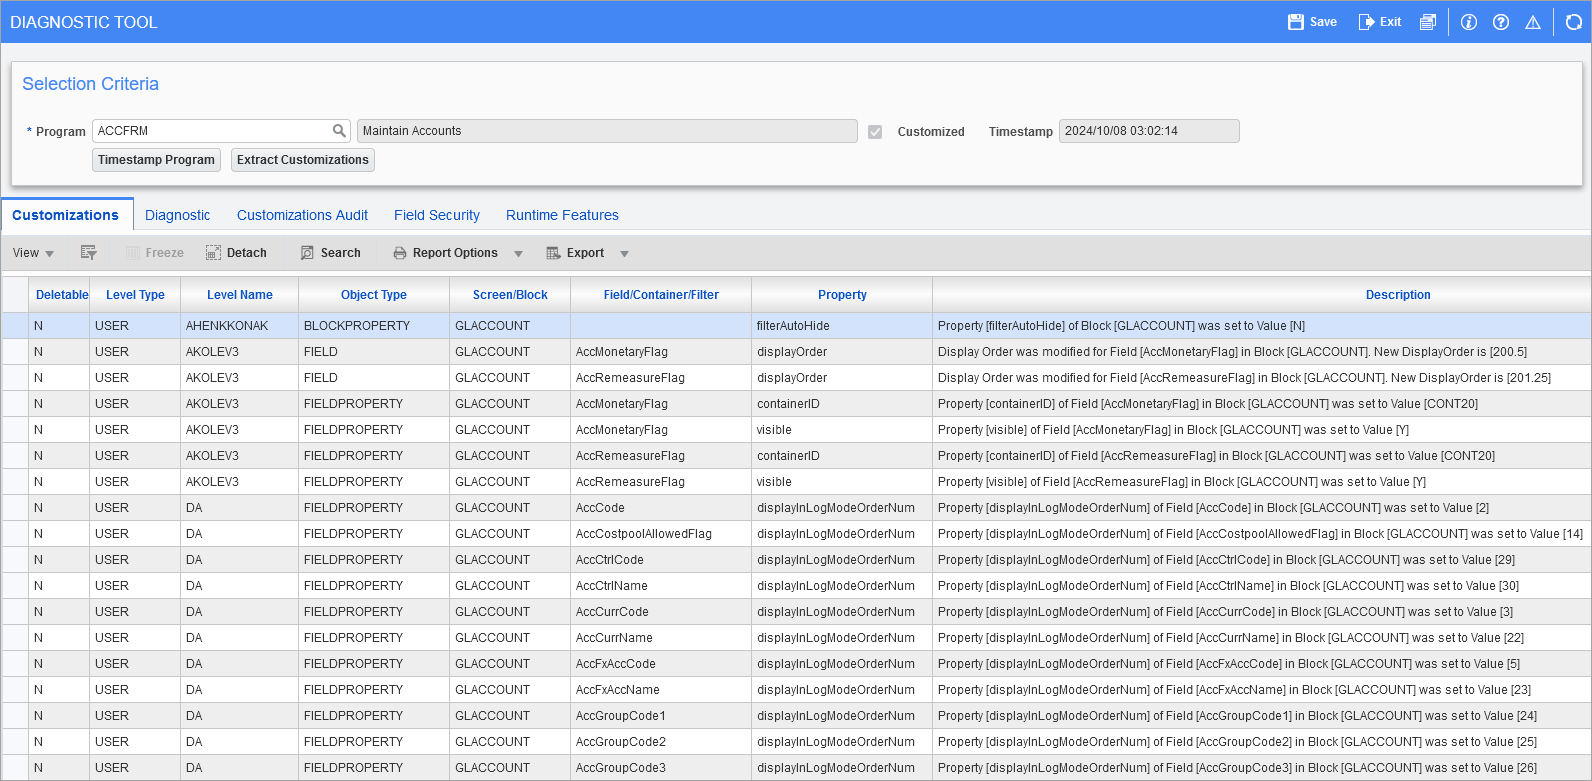
Pgm: DIAGNOSTIC_TOOL – Diagnostic Tool with program selected
This screen is designed to facilitate the process of debugging any customizations made to programs with the Lite Editor. Users can use this tool to view all Lite Editor customizations made to various programs, as well as any problems that may have arisen with the program's proper functioning as a result of those customizations. This screen also displays a thorough audit of any changes made.
Setup
Adding the Diagnostic Tools Program to the Treeview
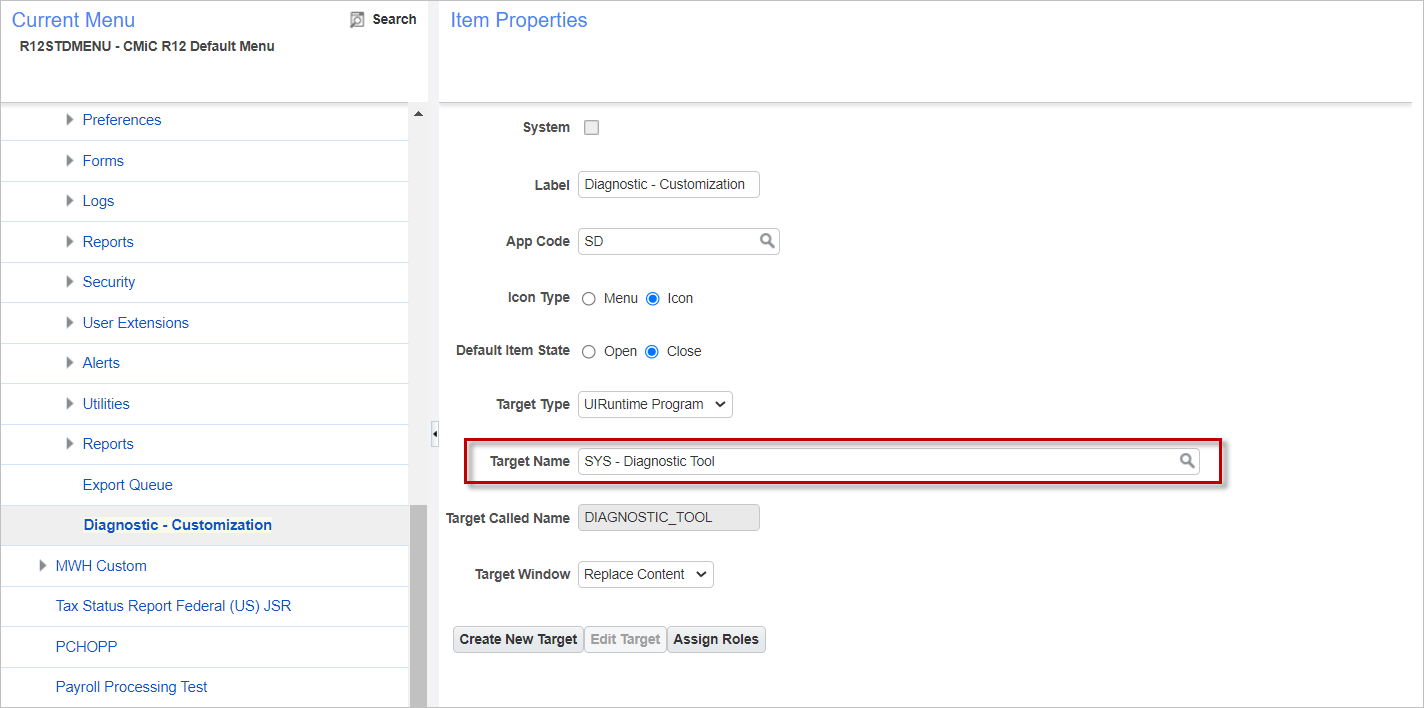
An example of how the Diagnostic Tool can be added to a custom Treeview with the Treeview Builder
The Diagnostic Tool does not appear in the standard Treeview for Enterprise. It can be added with the Treeview Builder - R12 tool using the Target Name "SYS - Diagnostic Tool", as shown above.
Who Can Run the Diagnostic Tool?
In Cloud environments, only users marked as a 'CMiC User' can access this program. Otherwise, if they try to access the program they will receive an error. This is to ensure that Cloud customers do not have the ability to remove functionality from screens that may affect other users in the environment.
In Cloud environments, "CMiC Users" as well as those not marked as "CMiC users" will be able to run the Diagnostic Tool screen. This will assist with seeing customizations applied to one or all programs. For Cloud Environments, the following functionality will not be available:
-
Timestamp Program
-
Extract Customizations
-
Delete customizations, even if they have the required Lite Editor privileges.
-
See BASE layer customizations
Non-Cloud customers must have the "UIDGNTOOL" privilege assigned to their user profile in order to use this screen. This can be assigned to the user in the System Privilege tab of CMiC Field - User Maintenance.
Diagnostic Tool Screen
Selection Criteria
Program
Enter/select the program code.
When selecting "ALL":
-
Only the Customizations tab is visible (the Diagnostic, Audit, and Standard tabs are hidden).
-
The 'Customized' checkbox and [Timestamp] button are hidden.
-
The program name is displayed.
-
The 'Deletable' checkbox is hidden.
Customized – Checkbox
Indicates whether the program is customized or not. If checked, the program is customized.
[Timestamp Program] – Button
Press this button to timestamp the program and all of its customizations. Please note that in Cloud environments, pressing this button affects all customers in that environment and there will be a slight delay for anyone using the timestamped program for the first time.
This button is available if either:
-
The system is single-tenant (i.e. non-Cloud) and the user is either marked as a CMiC user or has the Lite Editor privilege assigned to their user profile.
-
The system is multi-tenant (i.e. Cloud) and the user is marked as a CMiC user.
[Extract Customizations] – Button
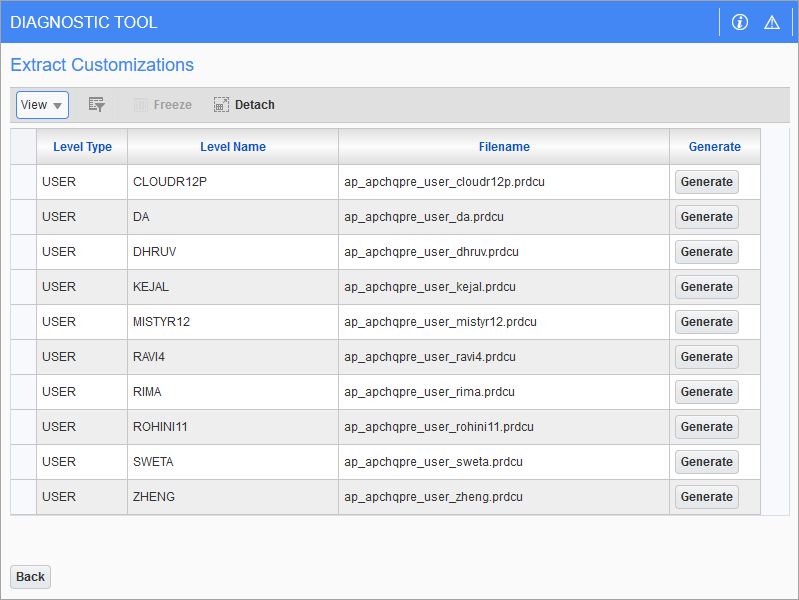
Pop-up window launched from [Extract Customizations] button
This button allows users to extract the customizations in a file by clicking the [Generate] button next to the associated file in the Extract Customizations pop-up window. This can be used to extract the customizations applied in one environment so that they can be uploaded in another environment.
Customizations – Tab
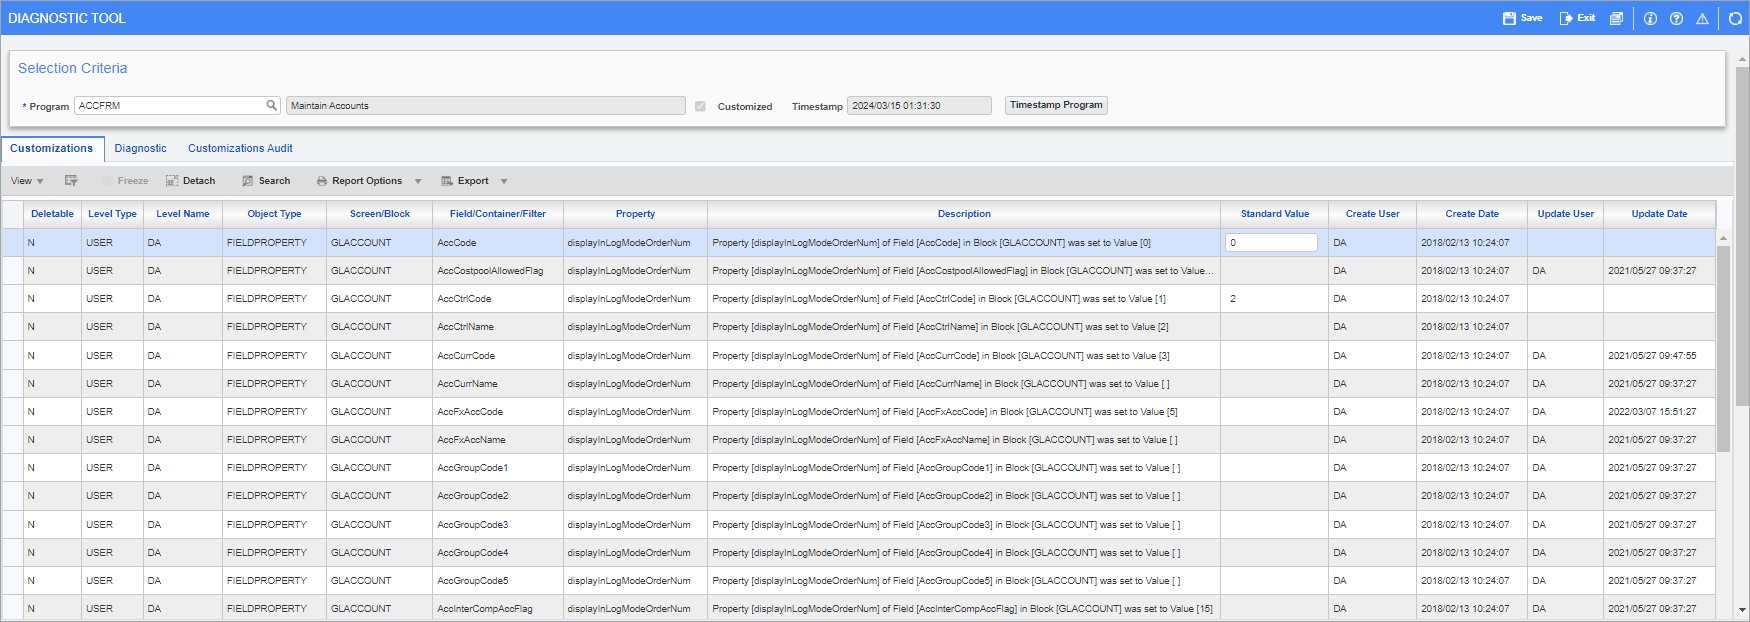
Pgm: DIAGNOSTIC_TOOL – Diagnostic Tool - Customizations tab
This tab shows all current customizations applied to the program. This table can be easily filtered by pressing the Query icon (![]() ) and searching each column for specific values.
) and searching each column for specific values.
Deletable
Customizations that have a "Y" value in this column can be deleted by selecting them and pressing the [Delete] button in the Section toolbar. This button does not appear if a customization with an "N" value is selected.
Custom added fields of the following type can be deleted: Heading, Spacer, Separator, Separator with Heading, and BIFrames.
Whether a customization is deletable depends on the user's Lite Editor privileges, as well as what the Diagnostic Tool itself deems essential to the programs proper functioning. The Configuration Privileges tab of CMiC Field - User Maintenance determines the level at which the user can make changes to the Lite Editor program. If the user does not have the privilege necessary to edit customizations of a certain level, then those customizations will have an "N" in this column. There may be customizations that the user has access to but that still appear as undeletable; this may be because removing them would break the program. If the user still wishes to remove the customization in such cases they should remove them by going through the Lite Editor.
Level Type, Level Name
Indicates the level at which the customization was made.
When running the Diagnostic Tool in Tenanted environments, data for the Base level assigned to the Tenant will also be listed. The Base level data will be listed at the end of the table (after Client and UIC levels).
Object Type, Screen/Block, Field/Container/Filter, Property
These fields indicate which screen was customized and where on the screen the changes where made.
Description
This field shows the specific customization that was made.
Standard Value
This column shows the standard value. This will allow users to easily compare against the customization value.
NOTE: Standard data will always be null for UDFs.
Create User, Create Date
These fields show when the change was made and who made it.
Update User, Update Date
If an update was made to the customization, these fields show who made it and when.
Diagnostic – Tab
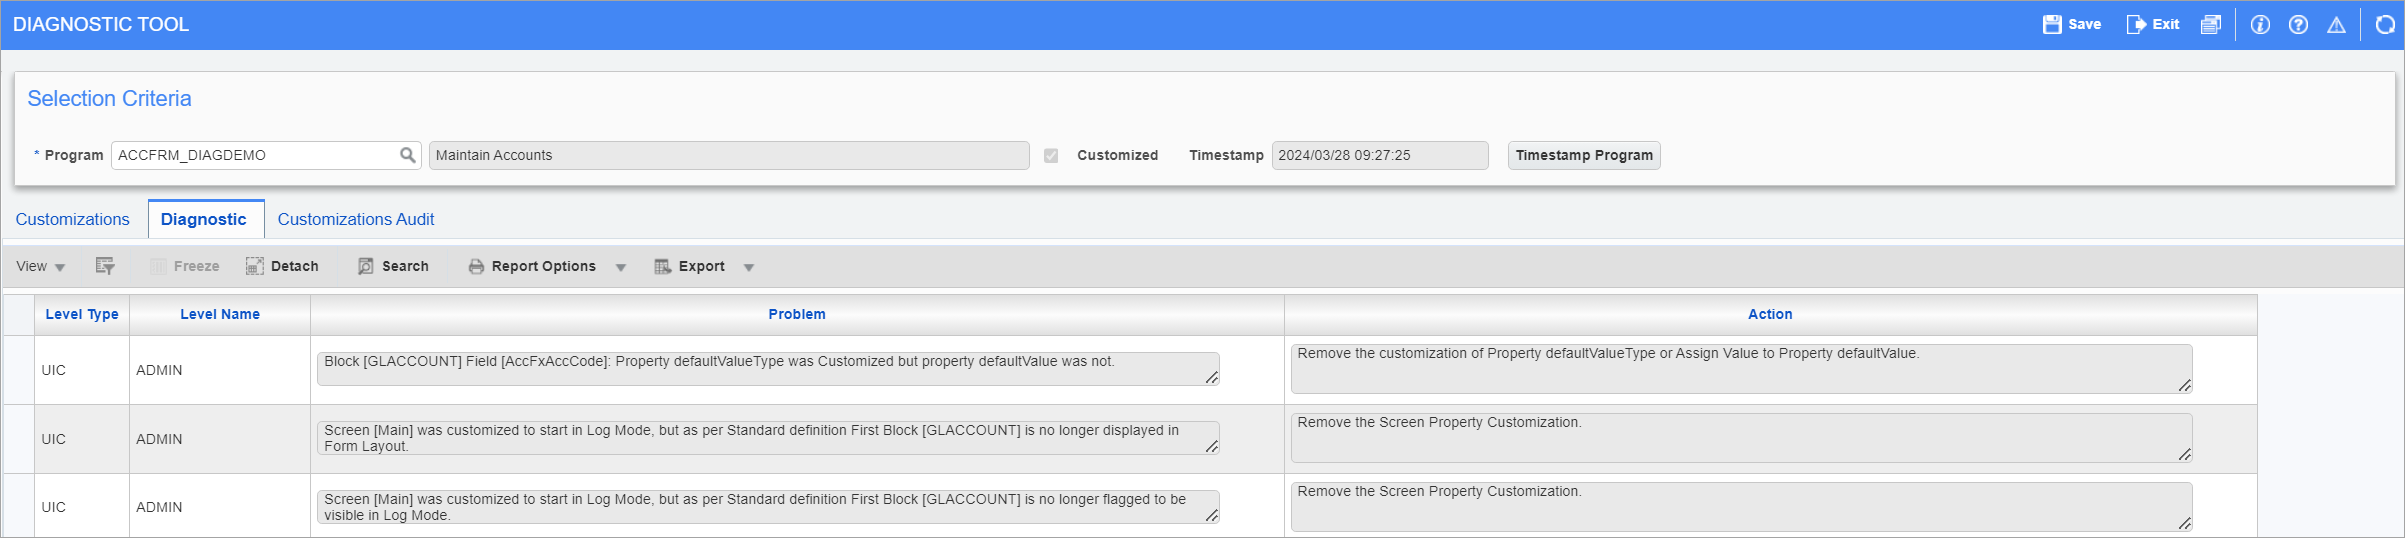
Pgm: DIAGNOSTIC_TOOL – Diagnostic Tool - Diagnostic tab
This tab shows any problems encountered after a program has been selected, along with any actions suggested by the Diagnostic Tool.
Customizations Audit – Tab
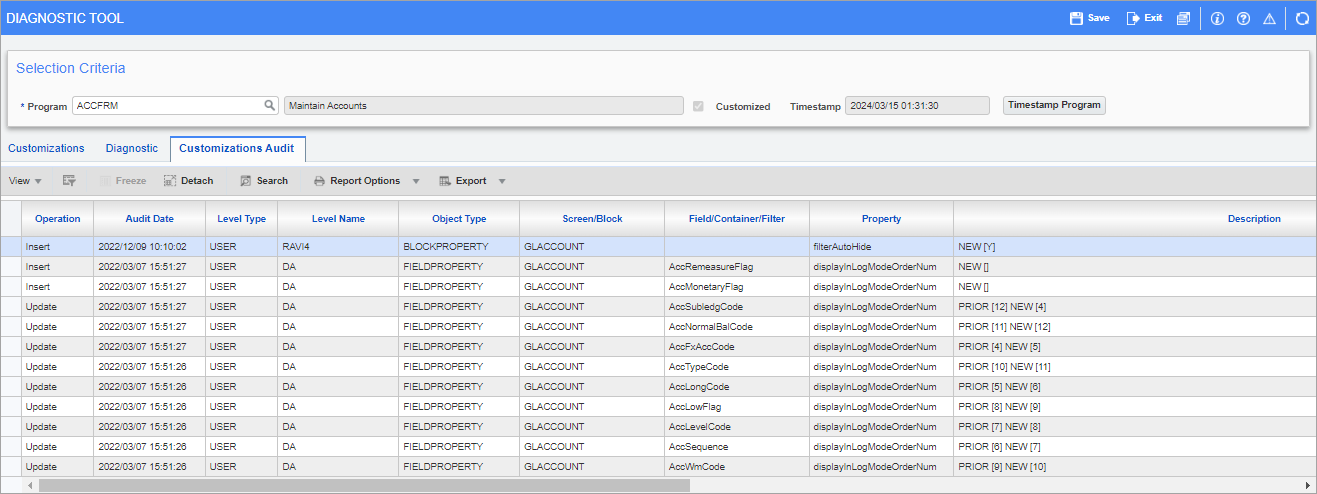
Pgm: DIAGNOSTIC_TOOL – Diagnostic Tool - Customizations Audit tab
The Customizations Audit tab provides a full audit of all customizations made to the selected program. Users can see what was changed about the program as well as who made the changes and when.
Field Security – Tab
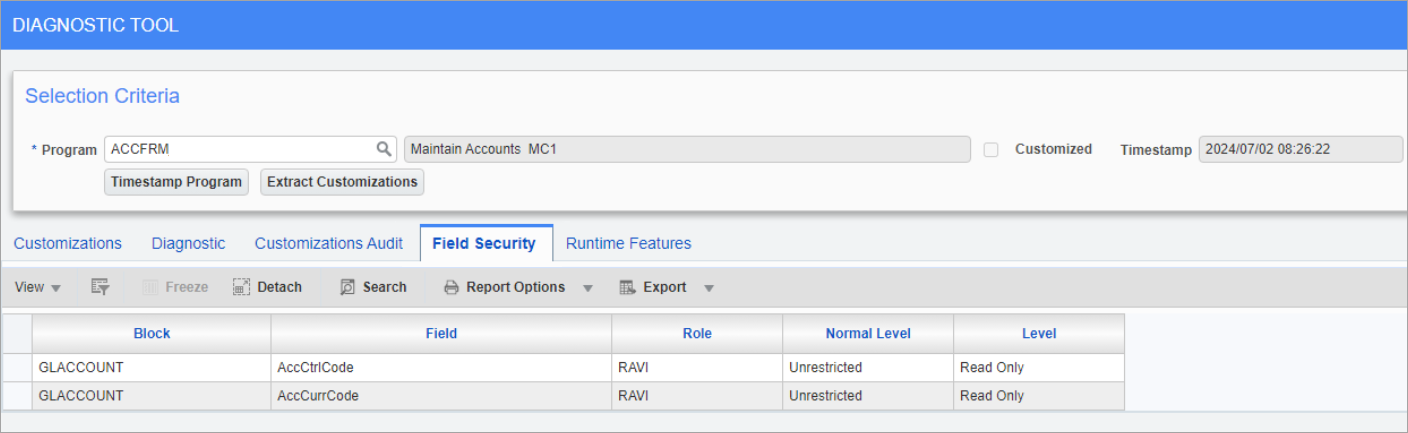
The Field Security tab lists the field security for the selected program. This is important information as it could explain things such as why a field is not visible or disabled for some users.
Runtime Features – Tab
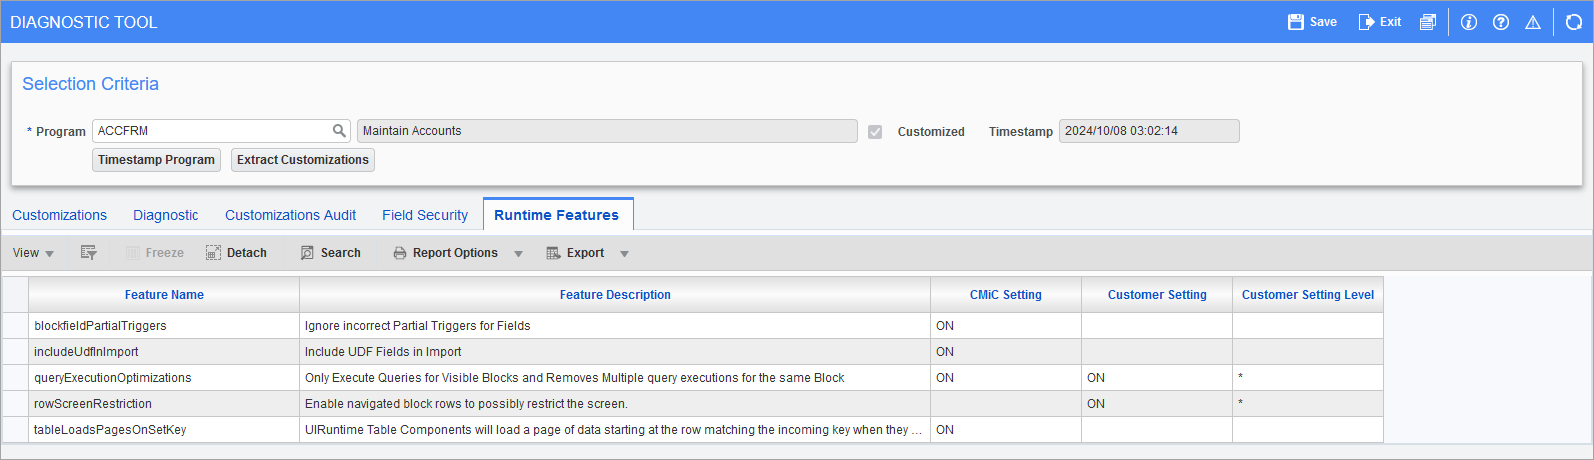
Pgm: DIAGNOSTIC_TOOL – Diagnostic Tool - Runtime Features tab
The Runtime Features tab lists the runtime features that apply to the selected program.