Scheduling 2.0 - Earned Value Management
NOTE: Scheduling 2.0 has been deprecated and is no longer supported by CMiC. See Product End of Support for further details.
The Earned Value Management module is used to monitor and report on planned vs actual quantities and units for a project to see if it is on track. Earned Value Management identifies how much of the budget and time should have been spent, considering the amount of work done so far for self-performed projects.
The features available for Earned Value Management can be found under the Cost Planning sub-menu:
-
Activity Cost Details
-
Activity Cost Mapping
Activity Cost Details Planning
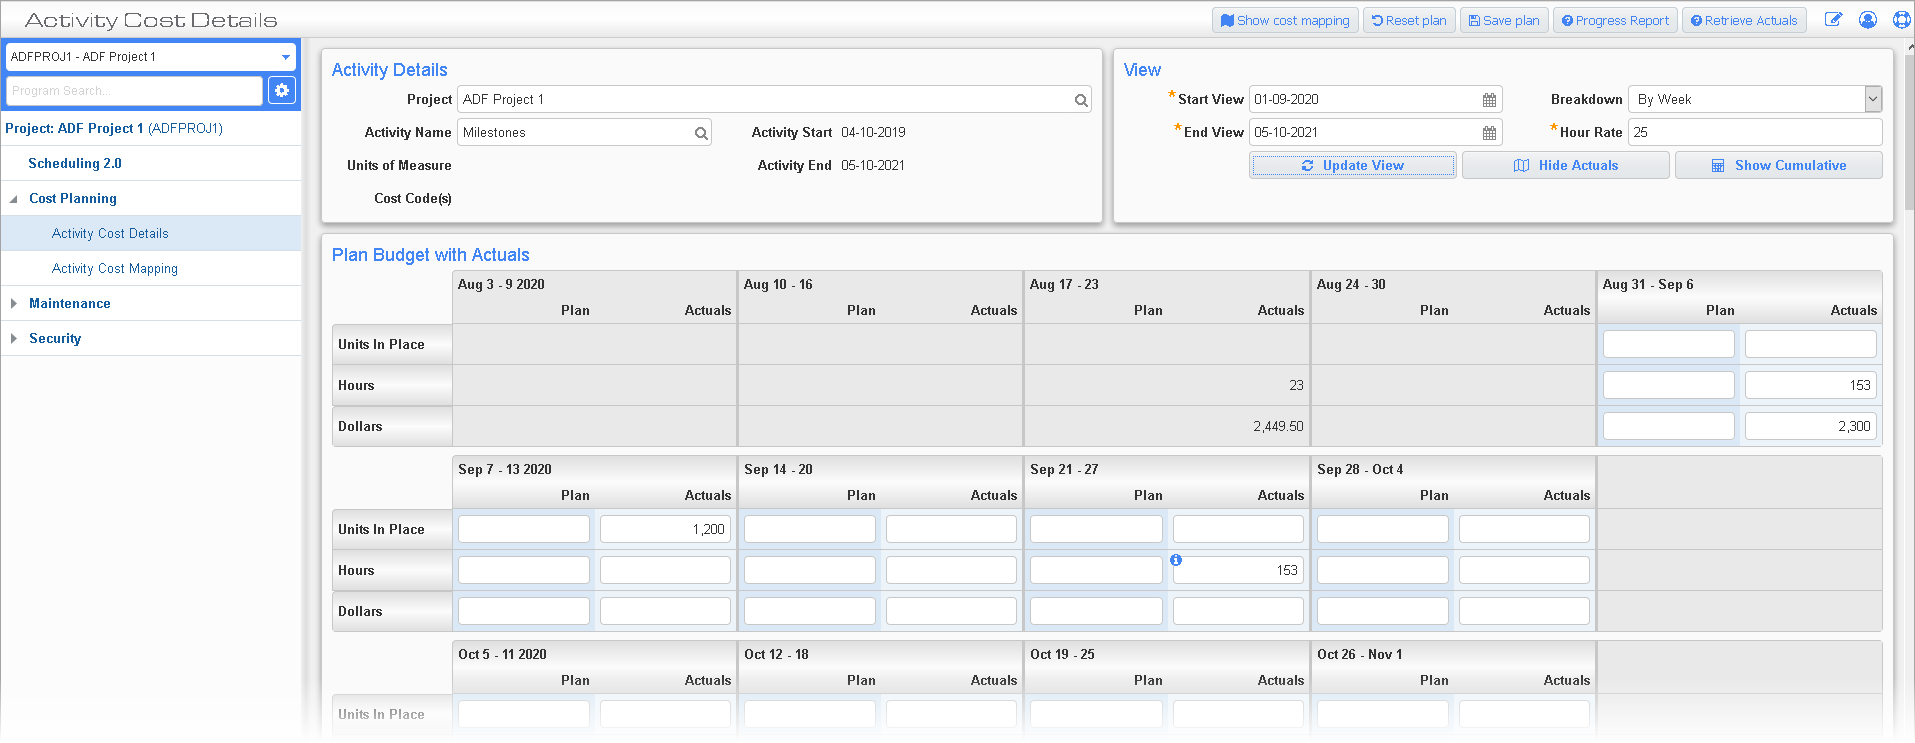
Activity Cost Details; standard Treeview path: Earned Value Management > Cost Planning > Activity Cost Details
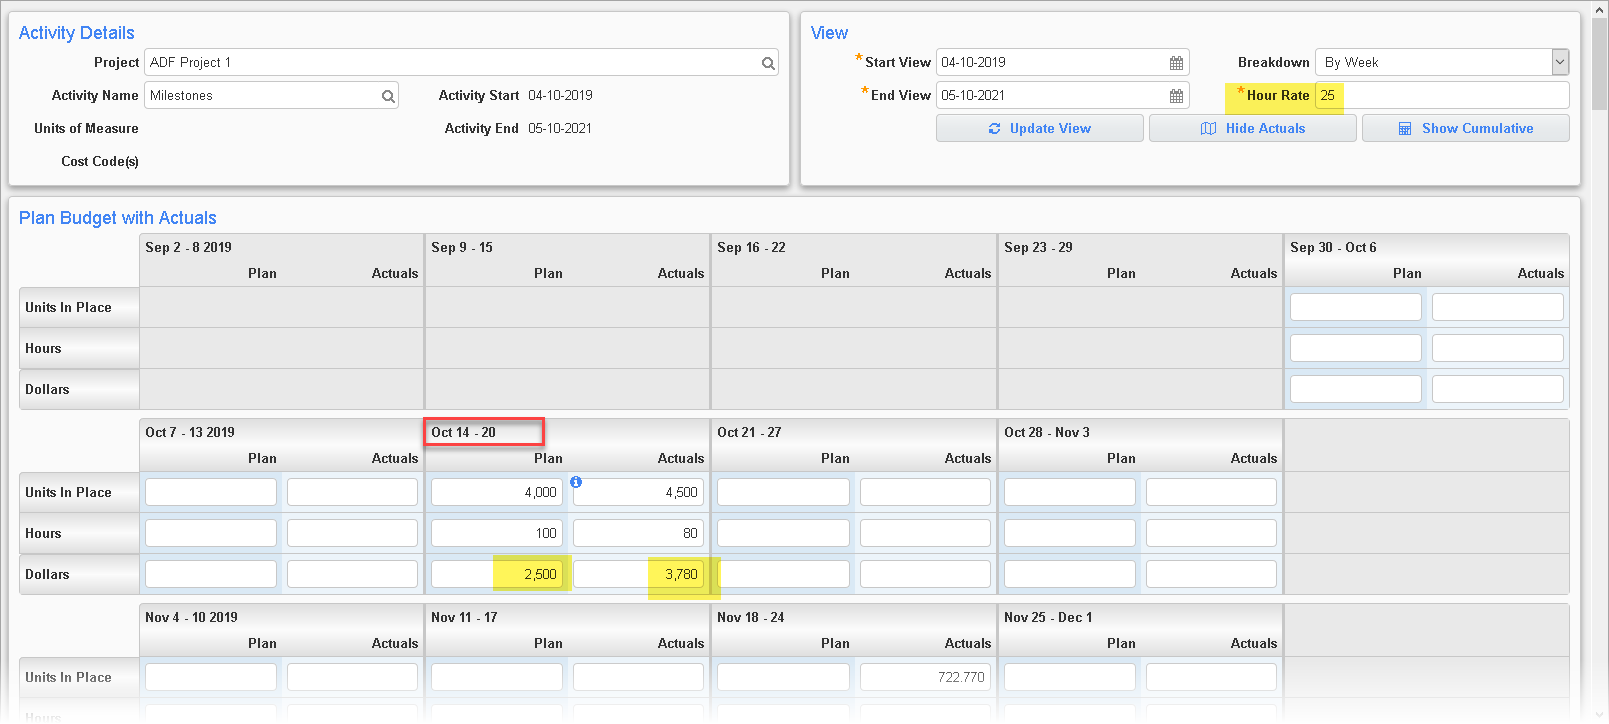
The Activity Cost Details screen provides the structure for defining the planned value to create a budget. The planned units for schedule activities are associated with CMiC cost codes via the Activity Cost Mapping screen.
It spans the activity from its start to finish dates. Planned units are tracked on the user’s selection of daily, weekly, or monthly periods using the Breakdown field.
The actuals come from the following sources (and are based on the mappings):
-
CMiC E-Time: Timesheet Entry and Crew Time Entry
-
Mobile Crew Time: Phase Quantity
-
Project Management: Daily Journal Units Complete tab
-
Mobile Field: Daily Journal Units Complete tab
-
Job Costing: Phase Quantity Completion
Breakdown
By Day – used to plan out units and hours for each day within a date range.
By Week – used to plan units and hours weekly. The units and hours entered in the weekly view is stored on the last day of the week from the project calendar.
By Month – used to plan out units and hours by months. Progress captured during the month is stored against the last business day of the month as per the activity calendar.
Use the [Update View] button to update the details on the screen to the selected view after selecting a value for the Breakdown field.
Planned dollars/budget = Hour Rate × Planned Hours
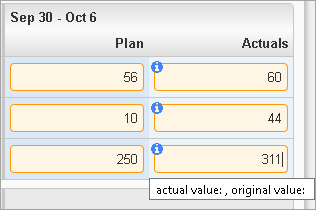
![]() indicates that the actual figures have been manually entered.
indicates that the actual figures have been manually entered.
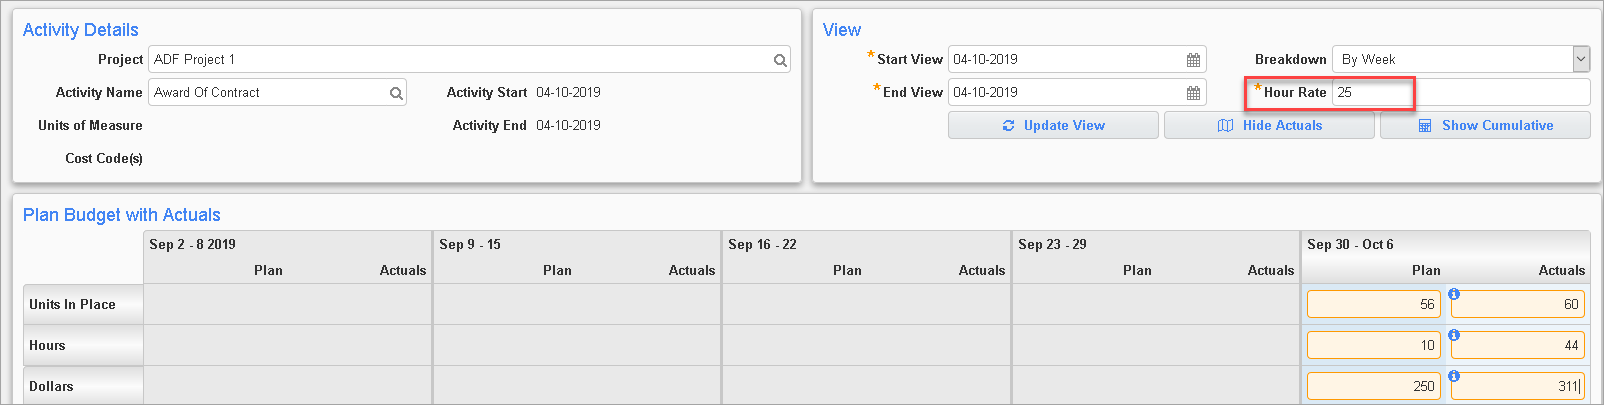
Position the cursor in the yellow field to see the actual value (if any) from the posted transactions:
Activity Cost Mapping
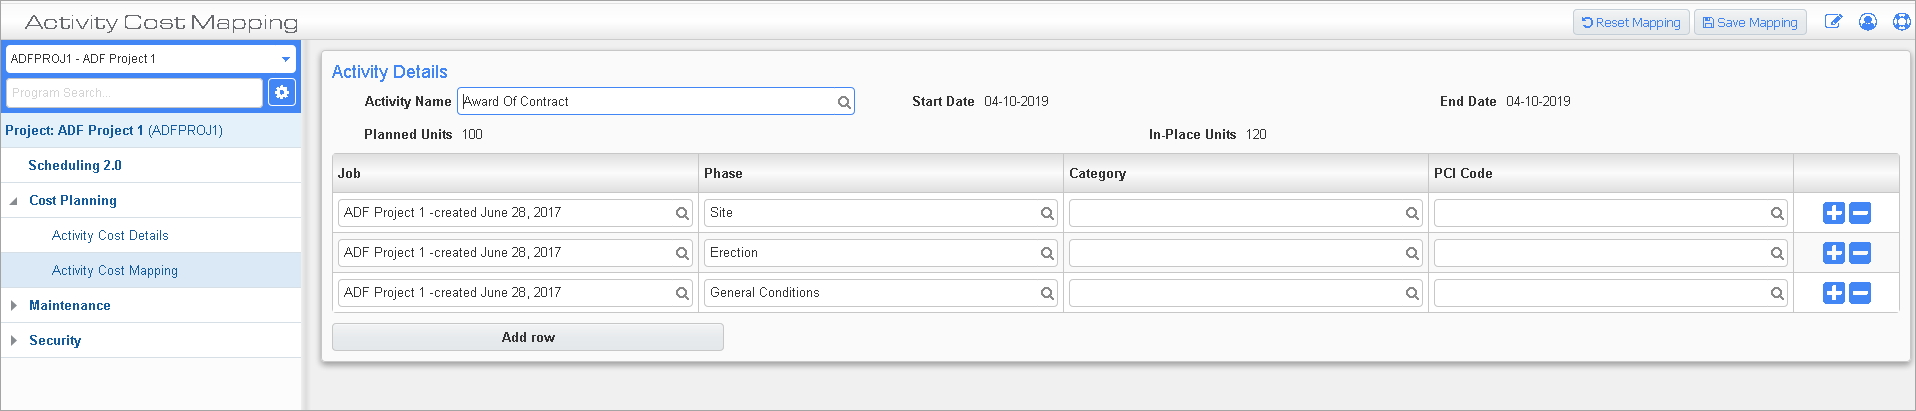
Example 1: Activity Cost Mapping; standard Treeview path: Earned Value Management > Cost Planning > Activity Cost Mapping
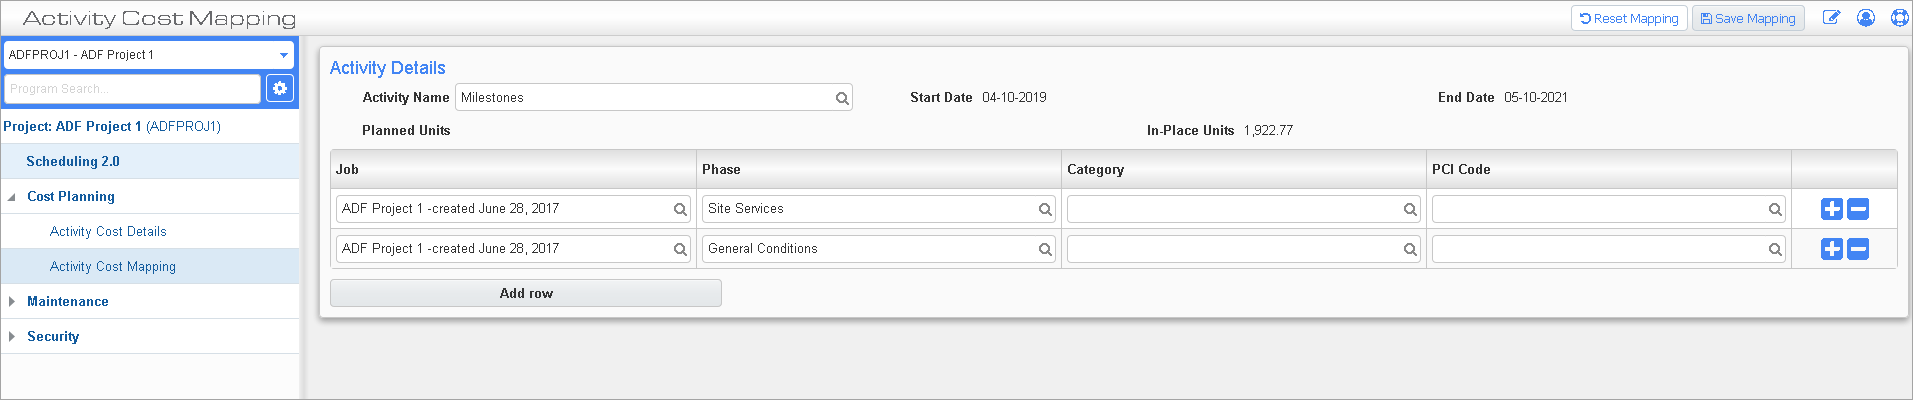
Example 2: Activity Cost Mapping; standard Treeview path: Earned Value Management > Cost Planning > Activity Cost Mapping
Schedule activities are mapped to cost codes so that actuals posted in the CMiC modules can be brought in for comparative analysis with planned costs.
The Activity Cost Mapping screen is used to map schedule activities to combinations of job, cost code, category, and WBS codes.
The units, hours, and amounts posted roll into the activity on the Activity Cost Details screen.
-
An activity can be mapped to a cost code.
-
Multiple activities can be mapped to a single cost code.
-
An activity can be mapped to multiple cost codes.
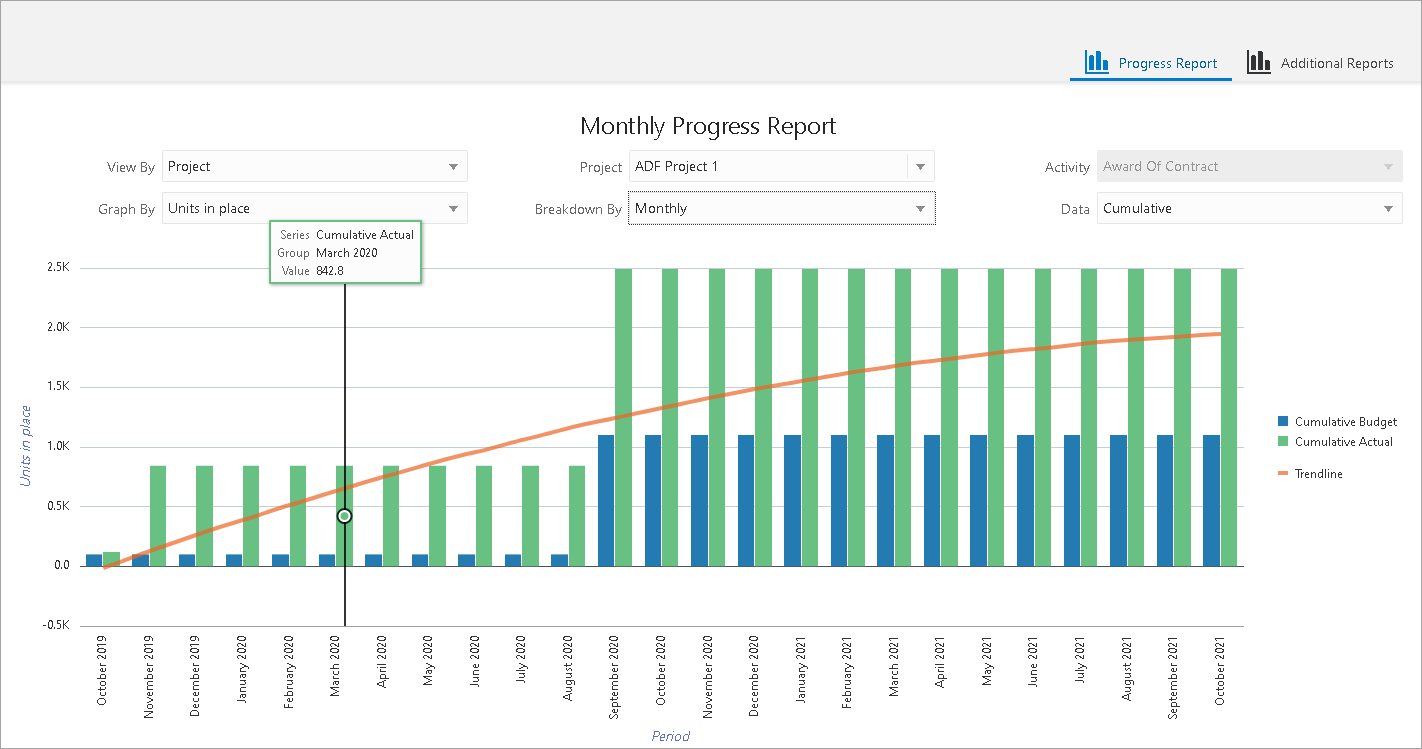
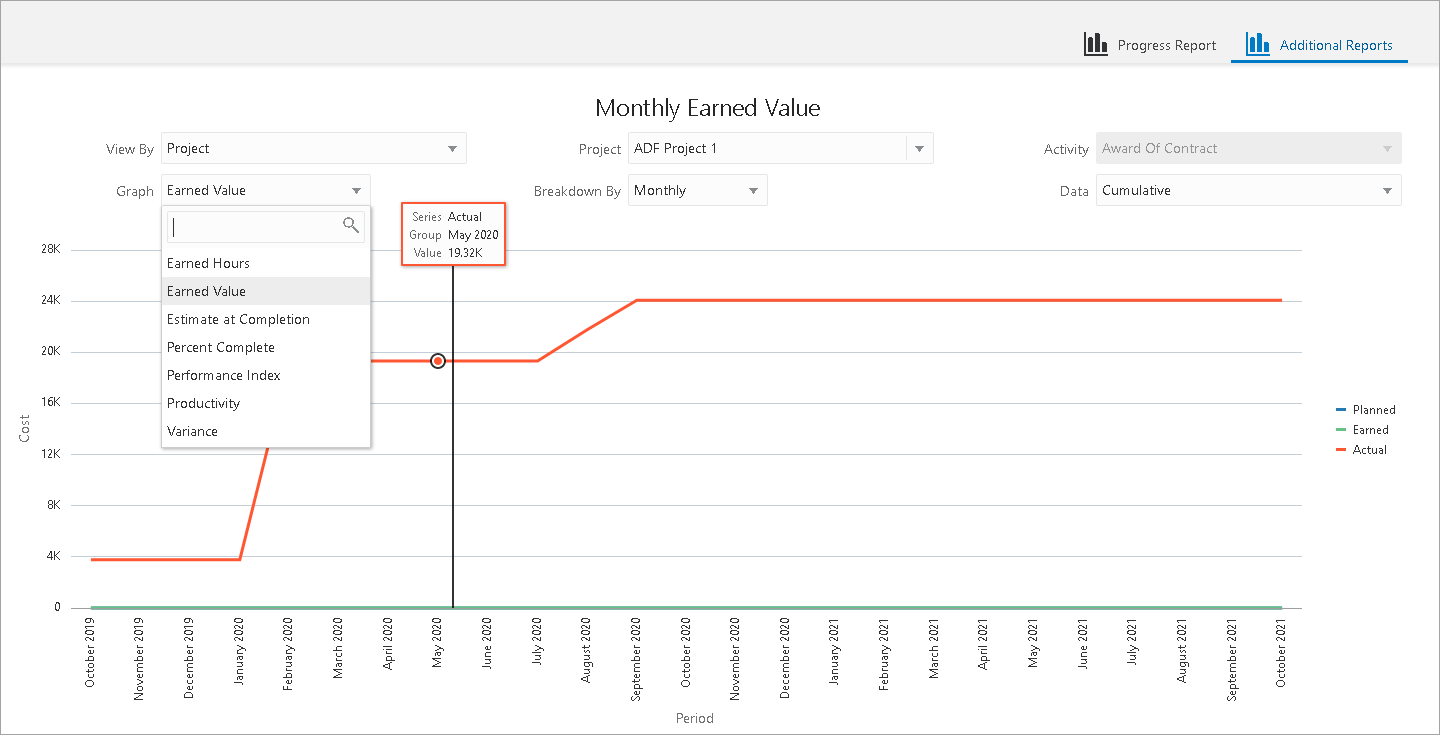
Report Samples
Progress Report
Additional Reports
Calculations
Example:
Currently for Week Oct 14-20, 2019 the graph shows:
Earned = 2.813k
Actual = 3.780k
Planned = 2.500k
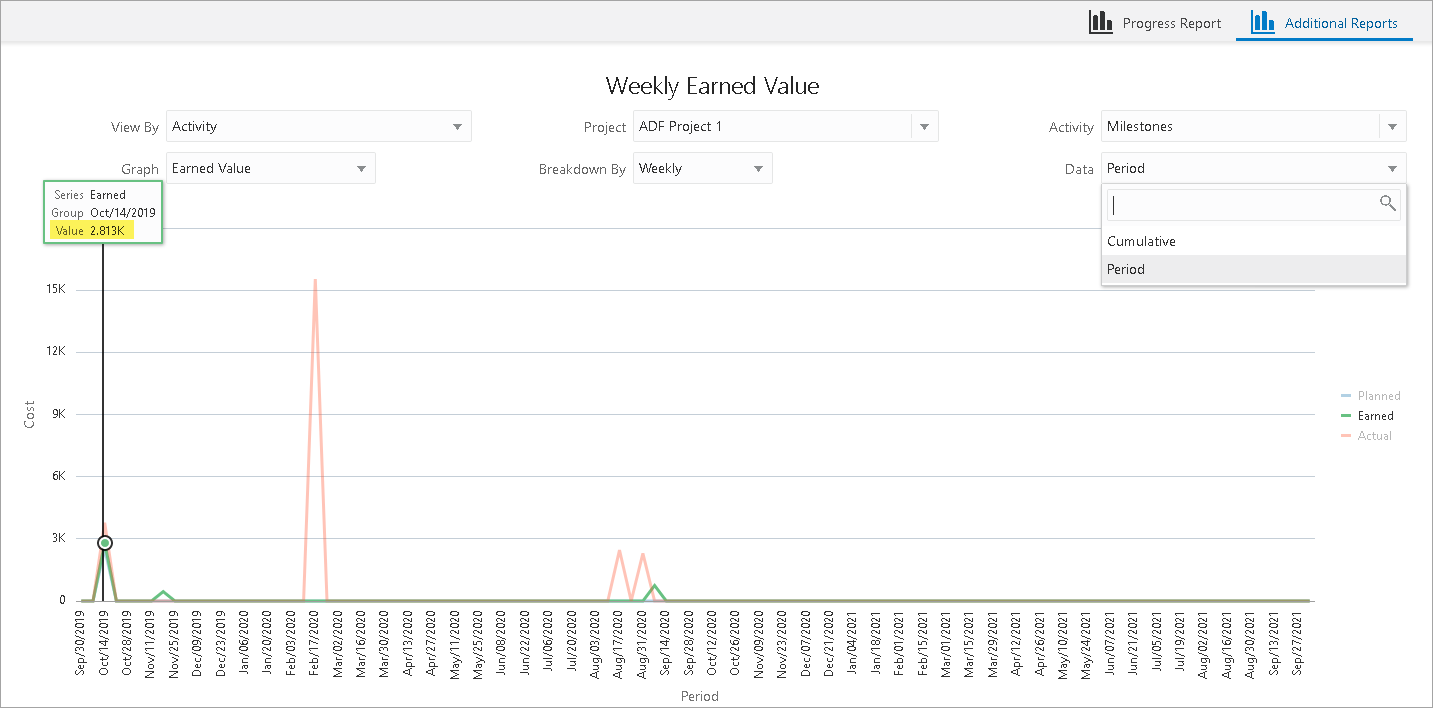
The calculation of the earned value is verified below:
Total Budgeted Cost = Budgeted Output Units / Budgeted Productivity × Budget Input Rate
Total Budgeted Cost = 4000/100×25 = 1000
Budget Cost of Work Performed = Current Output Units / Budgeted Productivity × Budget Input Rate
Budget Cost of Work Performed = 4500/100×25 = 1125
Actual Cost of Work Performed = Current Output Units / Current Productivity × Current Input Rate
Actual Cost of Work Performed = 4500/80×25 = 1406.25
Forecast = Forecast Output Units / Current Productivity × Current Input Rate
Forecast = 4000/80×25 = 1250
Earned Value Percentage = Actual Cost of Work Performed / Forecast
Earned Value Percentage = 1406.25/1250 = 1.125
Earned Revenue = Contract Amount × Earned Value Percentage
Earned Revenue = 2500×1.125 = 2812.5 = 2813 (rounded) = 2.813K