The budget spread rule calculation applies the trapezium rule to compute the value of the budget to allocate it to each time phased period.
Formula = (Area of Trapeziums for Period) ÷ (Total Spread Rule Trapezium Area) × Budget
The Area of Trapeziums for Period may consist of a sum of multiple fractions of Spread Rule Trapeziums coalesced together to make one time-phased period. The number of trapeziums determines where each trapezium starts and ends in the Spread Rule for each time phased period.
Example:
NOTE: Currently only the GLPERIOD (G/L period) interval option can be used for opportunities, as the other options are related to the deprecated detailed time phased budgeting functionality. For more information, please refer to Job Costing - Create Budget Spread Rule.
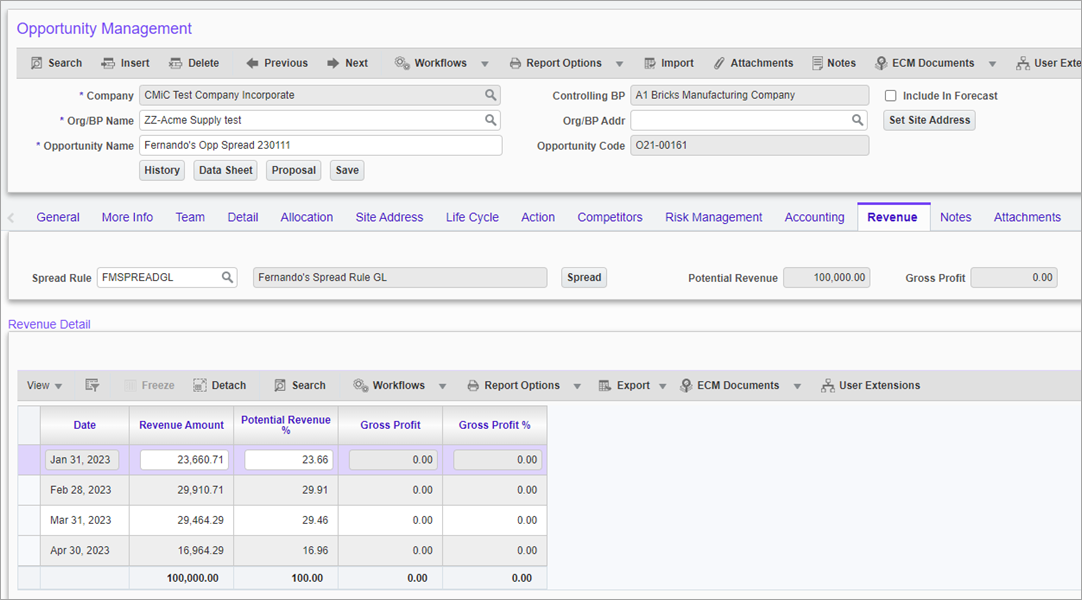
The following breaks down the calculation of the amounts from Opportunity Management.
Potential Revenue: $100,000.00
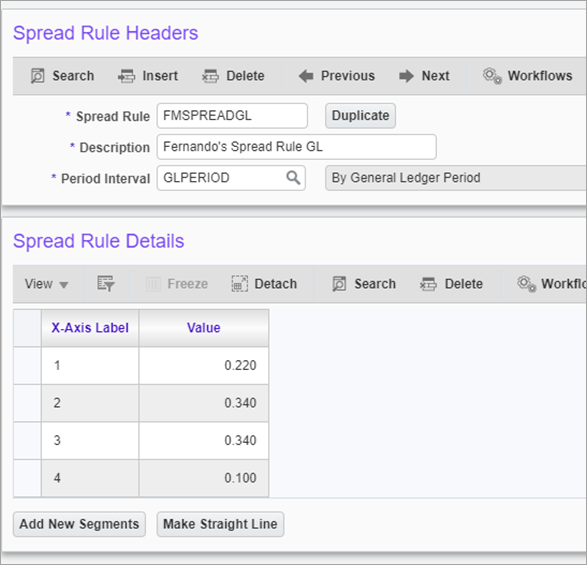
Spread Rule Details:
| X Axis | Y Axis |
|---|---|
| 1 | 0.22 |
| 2 | 0.34 |
| 3 | 0.34 |
| 4 | 0.1 |
The following is a Spread Rule Chart for reference of the use of trapeziums in the calculation.
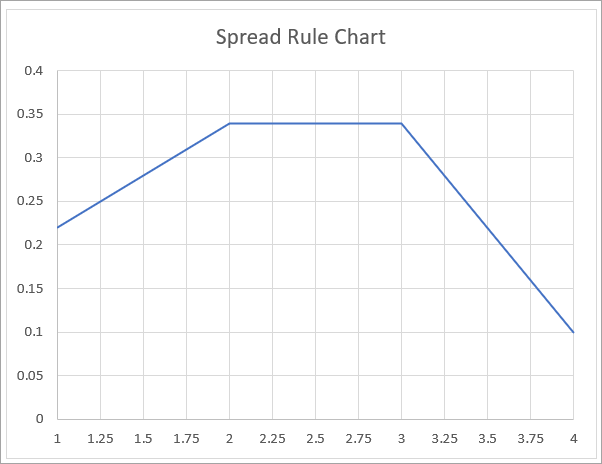
Trapezium Area Formula = ((a + b) ÷ 2) × h
Area between 1 and 2:
| a = 0.22 | b = 0.34 | h = 2-1 | Area = 0.28 |
Area between 2 and 3:
| a = 0.34 | b = 0.34 | h = 3-2 | Area = 0.34 |
Area between 3 and 4:
| a = 0.34 | b = 0.10 | h = 4-3 | Area = 0.22 |
Total area: 0.28 + 0.34 + 0.22 = 0.84
The total area of the chart for this spread rule is 0.84.
Trapezium Per Period Formula
Trapezium Per Period = (Spread Rule Count - 1) ÷ Effective Number of Periods
Where:
Spread Rule Count = 4 (Number of X Axis from Spread Rule Detail)
Effective Number of Periods = 4 (from Opportunity: Service End Date - Service Start Date)

Trapezium Per Period = ( 4 - 1 ) ÷ 4 = 0.75
The number of trapeziums per period is 0.75.
Defining X-Axis for the Trapeziums
The following is the X axis considering trapezium per period (starting at 1) until we hit the final period:
| 1 + 0.75 = 1.75 | 1.75 + 0.75 = 2.5 | 2.50 + 0.75 = 3.25 | 3.25 + 0.75 = 4 |
The following is the X axis inherited from the spread rule:
| 1 | 2 | 3 | 4 |
The following is the X axis to be used to calculate trapeziums (combination of all the above):
| 1 | 1.75 | 2 | 2.5 | 3 | 3.25 | 4 |
Defining Y-Axis for the Trapeziums
The following shows the correspondent Y axis value for the X axis that comes from the budget spread detail:
| X | Y |
|---|---|
| 1 | 0.22 |
| 1.75 | |
| 2 | 0.34 |
| 2.5 | |
| 3 | 0.34 |
| 3.25 | |
| 4 | 0.1 |
Intermediate values must be calculated:
| X | Difference between points (Y) | Difference between current and prev X | Proportion of the difference between Y | Y |
|---|---|---|---|---|
| 1 | 0.22 | |||
| 1.75 | 0.34 - 0.22 = 0.12 | 1.75 - 1 = 0.75 | 0.12 * 0.75 = 0.09 | 0.22 + 0.09 = 0.31 |
| 2 | 0.34 | |||
| 2.5 | Same logic, but since Y is the same for 2 and 3, 2.5 will also be 0.34 (linear) | 0.34 | ||
| 3 | 0.34 | |||
| 3.25 | 0.1 - 0.34 = -0.24 | 3.25 - 3 = 0.25 | -0.24 * 0.25 = -0.06 | 0.34 + ( -0.06 ) = 0.28 |
| 4 | 0.1 | |||
Matrix of the edges (x1, x2, y1, y2) of all trapeziums and their area (calculated by the trapezium area formula):
| x1 | y1 | x2 | y2 | Area | Period | |
|---|---|---|---|---|---|---|
| t1 | 1 | 0.22 | 1.75 | 0.31 | 0.19875 | First period (x1 = 1) |
| t2 | 1.75 | 0.31 | 2 | 0.34 | 0.08125 | Second period (x2 = 2) |
| t3 | 2 | 0.34 | 2.5 | 0.34 | 0.17 | Second period (x1 = 2) |
| t4 | 2.5 | 0.34 | 3 | 0.34 | 0.17 | Third period (x2 = 3) |
| t5 | 3 | 0.34 | 3.25 | 0.28 | 0.0775 | Third period (x1 = 3) |
| t6 | - | - | - | - | - | Fourth period is not calculated (it will be considered the remaining amount) |
Calculate the percentage of each sub-trapezium over the total trapezium area (0.84) and multiply by the budget. These are the final amounts that are seen in the opportunity:
Period 1: (0.19875 / 0.84) * 100,000.00 = 23,660.71 (23.66%)
Period 2: (0.08125 / 0.84) * 100,000.00 = 9675.61 + ((0.17 / 0.84) * 100,000.00) = 29,910.71 (29.91%)
Period 3: (0.17 / 0.84) * 100,000.00 = 20238.09 + ((0.0775 / 0.84) * 100,000.00) = 29,464.29 (29.46%)
Period 4: 100,000.00 - (23660.71 + 29910.71 + 29464.29) = 16,964.29 (16.96%)