Why is it Useful?
The Bubble Map visualization now allows for multiple data points in the same location, with the option to remove aggregation in the tooltip. This allows for a tabular view in the tooltip, and a visual indicator on the bubble to indicate that multiple records are being displayed.
NOTE: This feature was released in Patch 19.
How Does it Work?
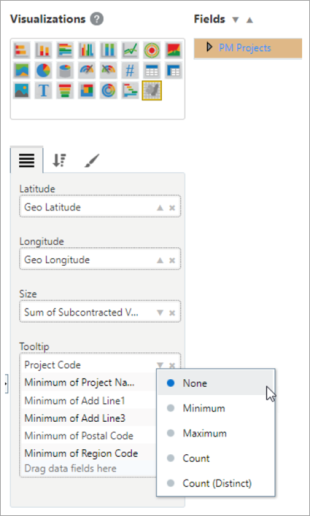
Remove aggregation (set aggregation option to “None”) for a tooltip plotting field. This makes it possible to retrieve entities sharing the same location.
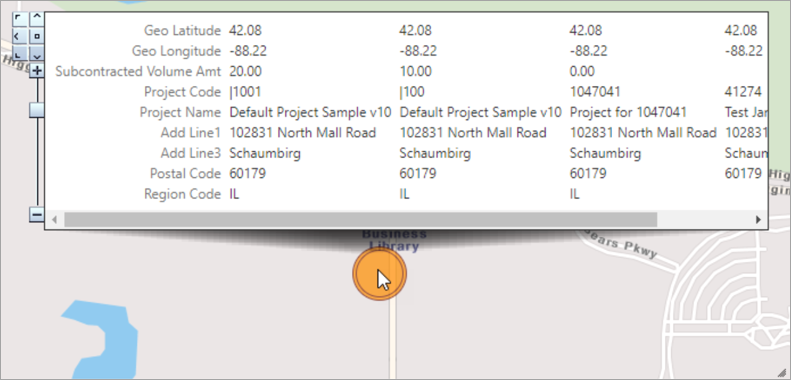
The bubble size is taken from the largest entity. Its tooltip text lists the information of all entities at the location.
To learn more about some of the latest features released in this patch, return to Patch 19 Highlights.