Why is it Useful?
In Patch 14-2, CMiC added a Gantt Chart visualization to the BI Dashboard Builder tool, which gave users the ability to make dashboards with Gantt charts. Now in Patch 15-1, CMiC has added a new default Resource Planning dashboard to BI Analytics, which uses the Gantt chart. This new dashboard allows you to view how you have scheduled your resources on a project in a Gantt chart. You can view all of your resources at once.
NOTE: This feature was released in Patch 15-1.
How Does it Work?
BI Analytics Standard Canvases
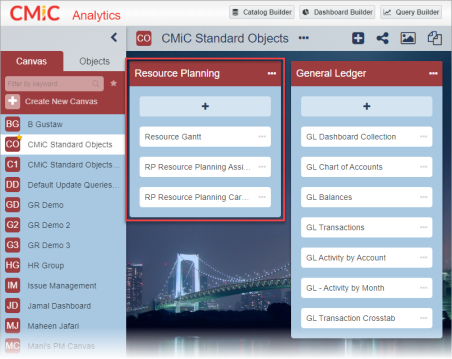
The new default Resource Planning dashboard is located in the Resource Planning bucket of the CMiC Standard Objects canvas in BI Analytics.
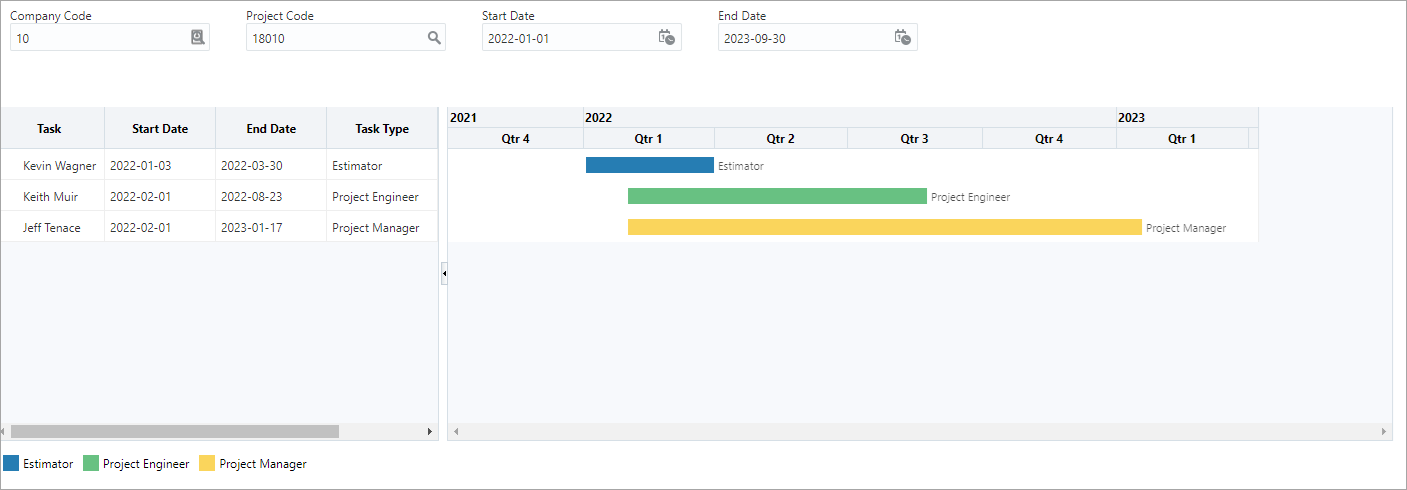
The Resource Planning dashboard displays information about the project resources and when their tasks are scheduled in the Resource Planning module. The user can look at data from specific date ranges and for a particular project. First, a Gantt chart displays the start and end dates of each task on a project. The Gantt chart allows you to quickly determine short- and long-term tasks, and when they start and end relative to each other. It is also colored by task type.
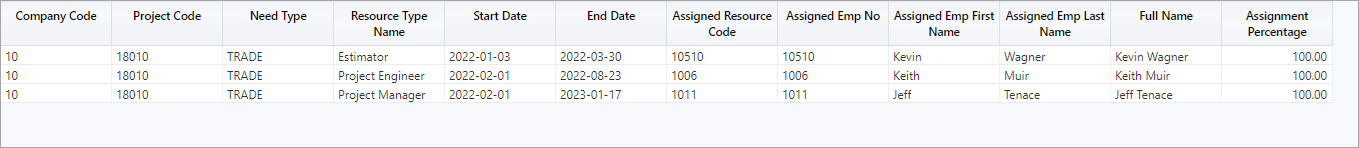
Next, a table shows the same information with a bit more details in tabular form. Here, you can see the assignment percentage of the employees doing each task along with their employee number.