Why is it Useful?
CMiC has added a Gantt Chart visualization to the BI Dashboard Builder tool. The Gantt Chart visualization enables users to see information that has start and end dates, in a way that is useful for resource planning and other project planning.
NOTE: This feature was released in Patch 14-2 under Issue 21.42008.
How Does it Work?
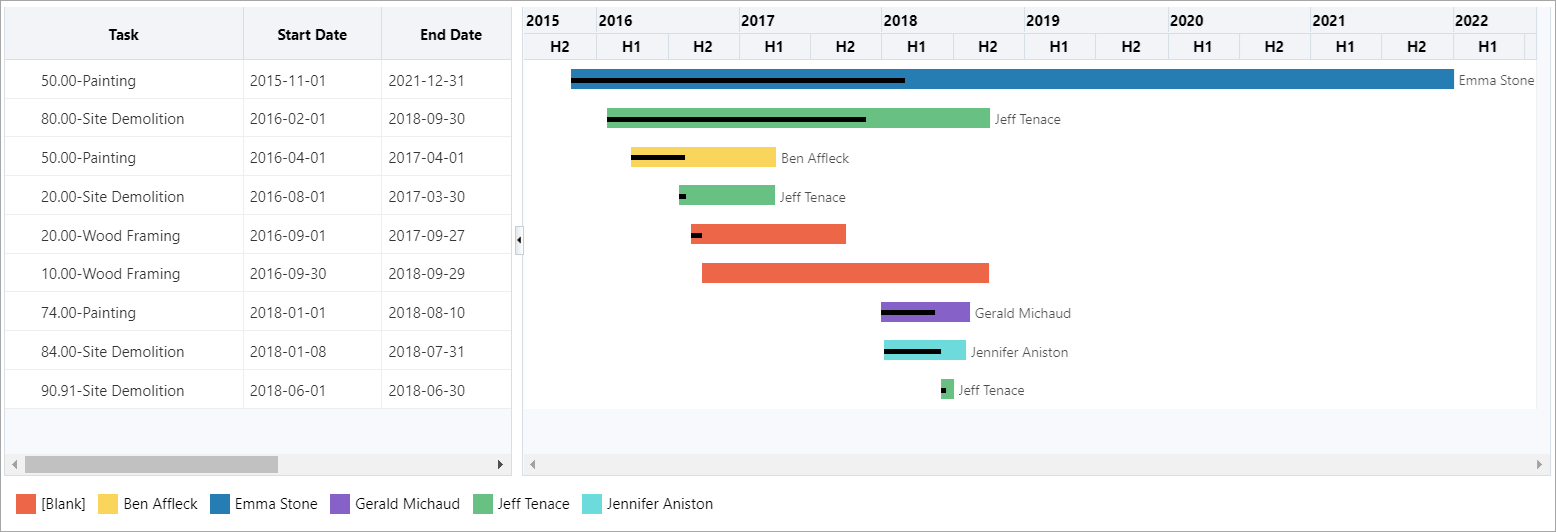
Example of Gantt Chart Visualization in BI Dashboard Builder
To learn more about how a Gantt Chart visualization works, refer to BI Dashboard Builder - Gantt Chart Visualizations.