Overview
Pgm: DOCFRM2 – Financial Document Formatting; standard Treeview path: General Ledger > Reports > Financial Document Formatter
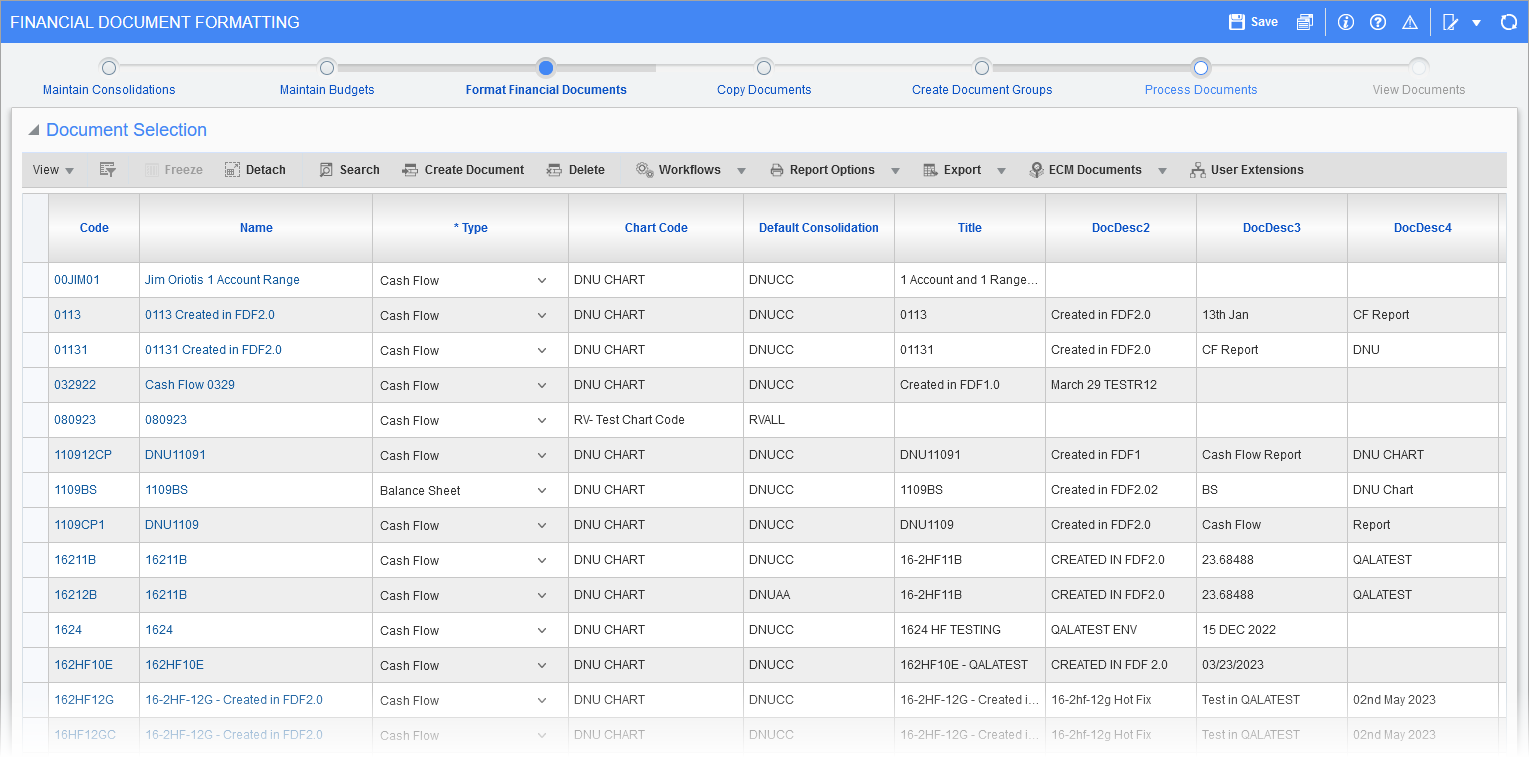
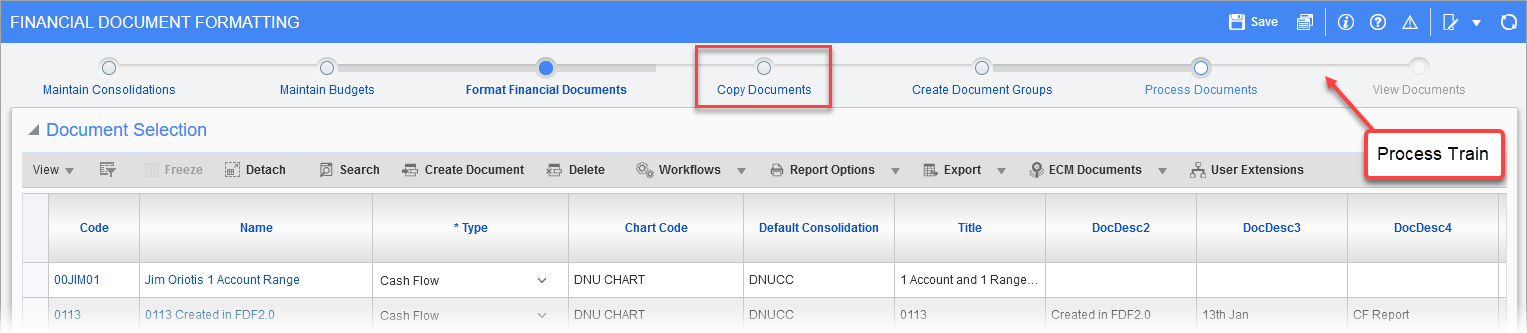
The Financial Document Formatting screen allows the user to design various custom financial document types about account balances beyond the balance sheet or income statement types. This screen is also used to print these documents either individually or as a group. These operations are performed via the four options in the process train that runs along the top of the screen (shown above).
Format Financial Documents
This screen lists all documents created using the Financial Document Formatting screen. Both copied and new documents are displayed in alphabetical order, by code. Use this screen to make changes to any available financial documents, otherwise click [Add New] to create a new document from scratch.
There are two options for creating a new financial document:
1. Create New Financial Document from Scratch
To do so, click [Add New] along the top of the screen (shown above). See the Create New Financial Document from Scratch section for further details.
2. Copy Document
Existing financial documents may be copied and altered to create variant versions of them (quickest way to create a new financial document). This is done via the Copy Document screen of the process train.
Copy Document
The Copy Document screen is used to create a copy of an existing document. It is displayed by clicking the Copy Document screen of the process train on the top of the Financial Document Formatting screen (shown above). The document’s defined rows, columns, and format are copied to the new document.
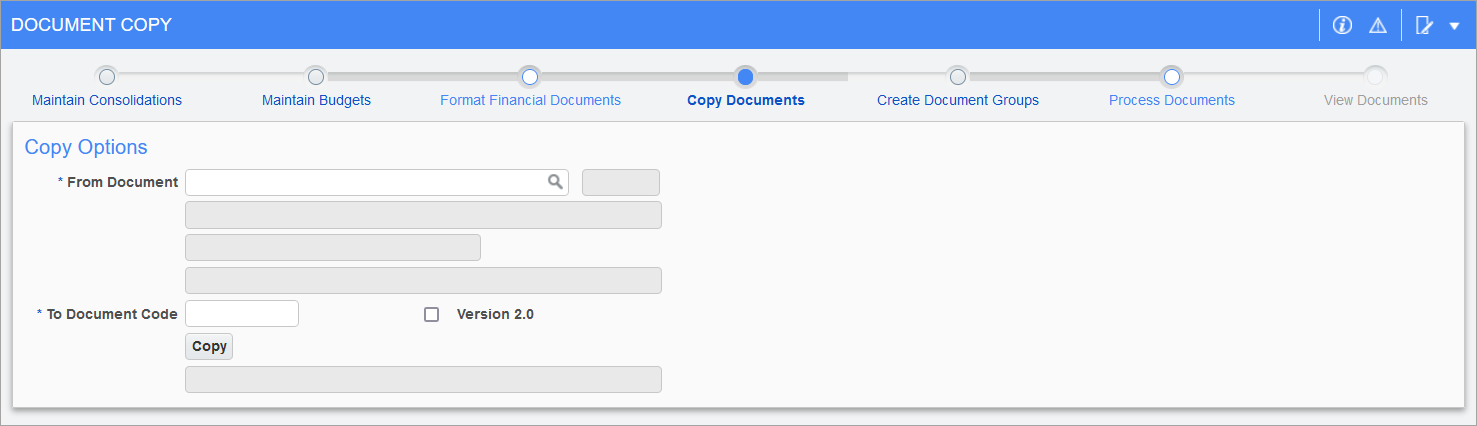
Pgm: DOCCOPY – Document Copy; standard Treeview path: General Ledger > Reports > Financial Document Formatter – Copy Document node
This may be required, for instance, if there are multiple companies using the same GL account codes. If different balance sheets and income statements all use the same basic format, it is much easier to create one and then copy that format for all the other companies. After copying, it is easy to pull up the new document and customize it for the company.
This functionality is also required to avoid modifying a currently used financial document when changes are required. To avoid corrupting an important financial document in use, copy the financial document and make changes to the copy before replacing the older version.
In the Copy Document screen shown above, select the financial document to copy via the From Document field, and enter an identifying code for the new copy via the To Document Code field (must be a new code). Then click the [Copy] button.
Create Document Groups
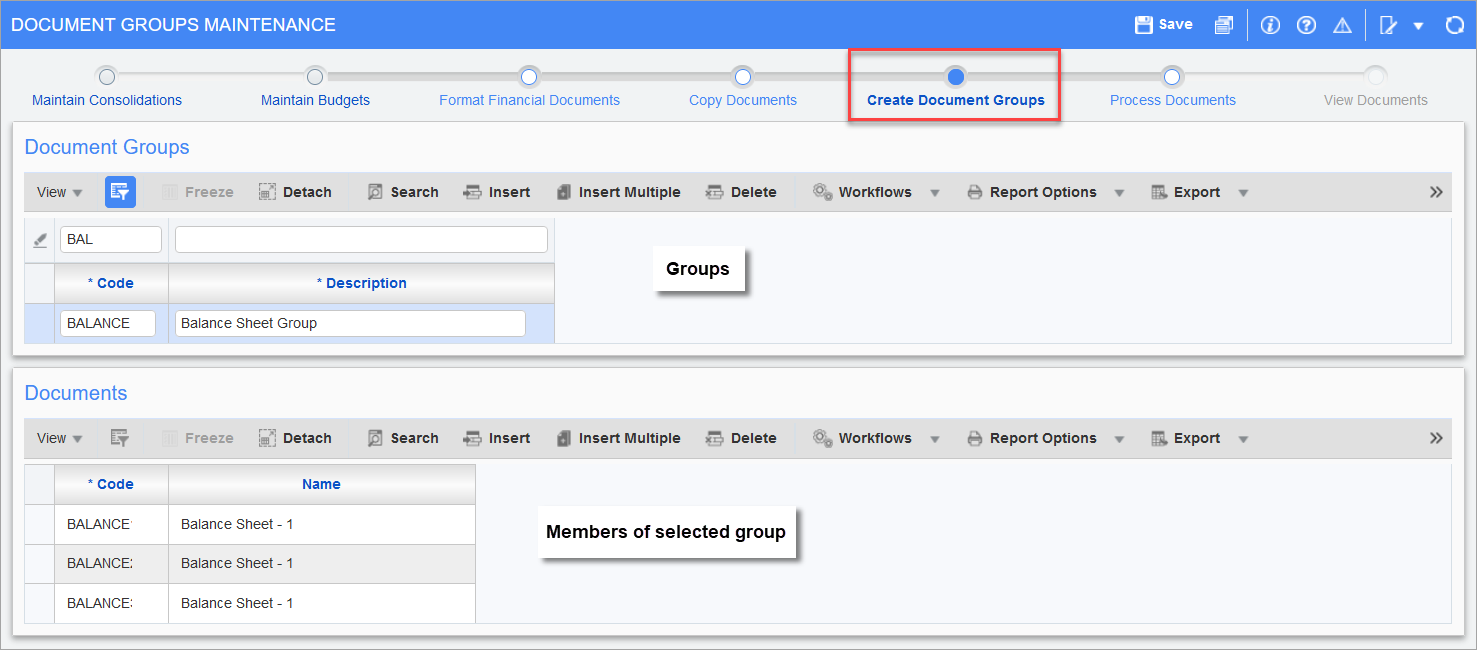
Pgm: DOCGROUP – Document Groups; standard Treeview path: General Ledger > Reports > Financial Document Formatter – Create Document Groups node
Document groups are a way to group individual financial documents together so that they can be easily selected as a group for printing. For instance, a batch of reports can be grouped by departments. This is an optional aspect to printing financial documents designed to make it easier to select the exact reports needed. For example, the user may have a document group of working reports and one of final reports. When the user prints by document group, the screen will only see those reports included in the group. Also, this feature allows the same report to be included in one or more document groups.
The upper section, Document Groups, lists all the document groups and the lower section displays the documents that belong to the group selected in the upper section.
Print Documents
Pgm: DOCPRINT – Document Printing; standard Treeview path: General Ledger > Reports > Financial Document Formatter – Print Documents node
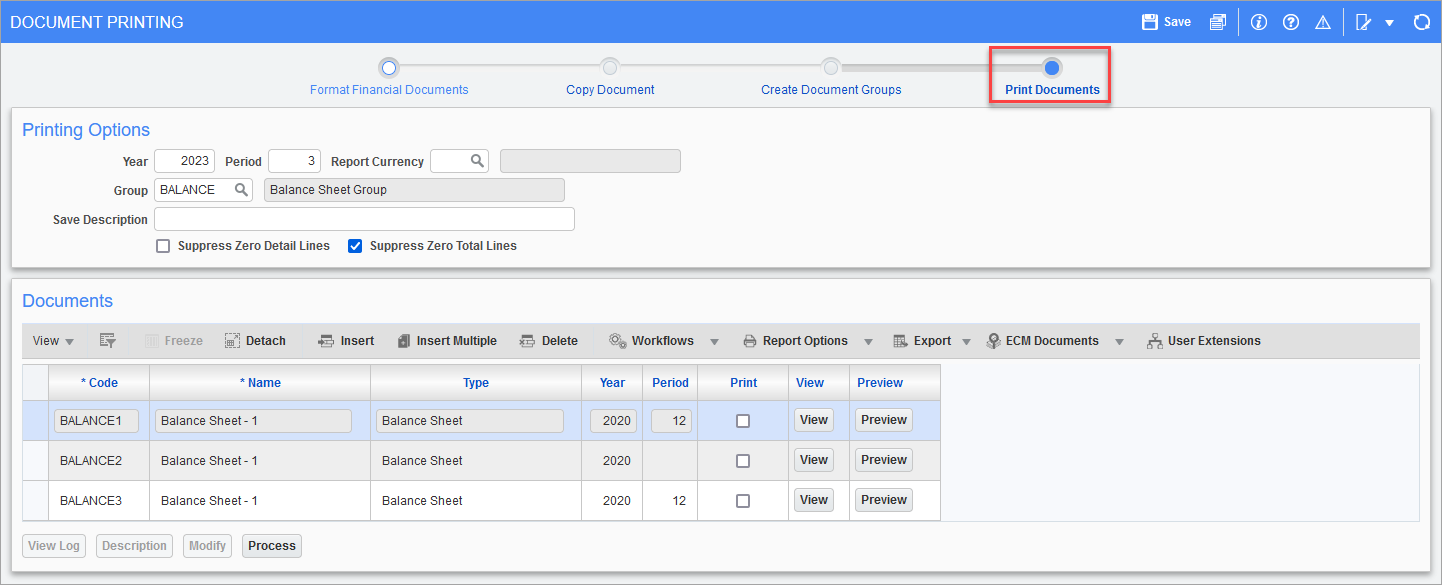
Use this screen to print selected financial documents created through the Financial Document Formatting screen. All documents created for every company will be displayed under the Documents section.
Printing financial documents can be done for any period, regardless of the current fiscal period or current date. The printing will define the current year and period as the period that you enter on this screen, and from that it calculates the year to date, prior year, and prior period as per the definitions of the report.
Printing Options – Section
Year
Enter the relevant year.
Period
Enter the fiscal period that will be considered the current period for the purposes of the document(s) being printed. If the document includes information from the current period, the screen will use the information for the period entered in this field.
The entry in this field will not affect document columns based on specific period balances or activity. If a specific period was entered on the document, the specific period entered on the document format will be used for those columns. The screen will default the current period to this field.
Group
If using document groups (see Create Document Groups section for details), enter or select the group of reports that are required to be processed, like a batch process.
Save Description
Enter information here.
Suppress Zero Detail Lines – Checkbox
Check if detail lines should not be printed on the document when the amounts to be displayed for the lines are all zeros.
Suppress Zero Total Lines – Checkbox
Check to permit the total line amounts having zero values to be printed on the document. If unchecked, all the GL account amounts being sub-totaled that add to zero on the sub-total line will be displayed.
Documents – Section
All documents for all companies are displayed in this section. For each document, the last time it was printed is recorded by the Year and Period fields.
Year
Displays year in which document was last printed.
Period
Displays period in which document was last printed.
Print – Checkbox
Check to select document for printing.
[View] – Button
The [View] button opens the detailed Document View pop-up window for the selected code. The Document View is read only and consists of rows of financial data. It shows all the values that will be printed when the user checks the ‘Print’ checkbox and clicks on the [Process] button.
[Preview] – Button
The [Preview] button opens a dynamic data preview in a pop-up window for the fiscal year and period specified in the Printing Options section.
'Suppress Zero Detail Lines' and 'Suppress Zero Total Lines' checkboxes are applicable for the Jasper report, but not for the preview.
The Financial Document Formatter 1.0 document preview will not have the same drill down ability to BI query like the Financial Document Formatter 2.0 has. The year and period specified on the selected row in the Documents section displays the year and period for the previous Jasper report run.
[View Log] – Button
Displays a log of printed documents. The log displays the number of documents printed, deleted, saved, and their JOBID numbers. This will become enabled once documents have been printed.
[Description] – Button
Used to provide a description when saving a generated document.
[Modify] – Button
Used to modify the document’s four title lines, for printing purposes only. Also, for printing purposes, used to modify the document’s sequence number’s consolidation codes, and its top and bottom headings.
[Process] – Button
Generates the documents with the ‘Print’ box checked.
Create New Financial Document from Scratch
Each new document is created by defining three different areas, the header, the rows, and the columns. The following steps are required to create a financial document from scratch:
Part 2: Define Document Header
Part 3: Document Row Formatting
Part 4: Document Column Formatting
Part 5: Hide Specific Cells or Reverse Sign (Optional)
Part 1: Create Initial Layout
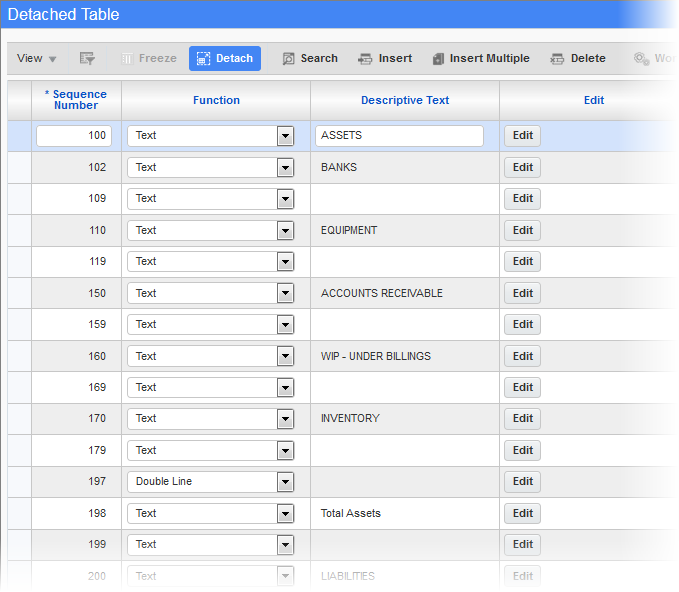
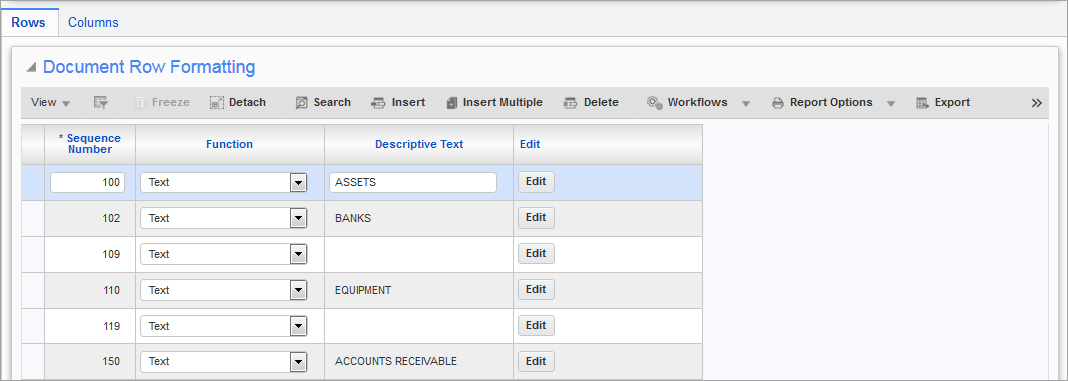
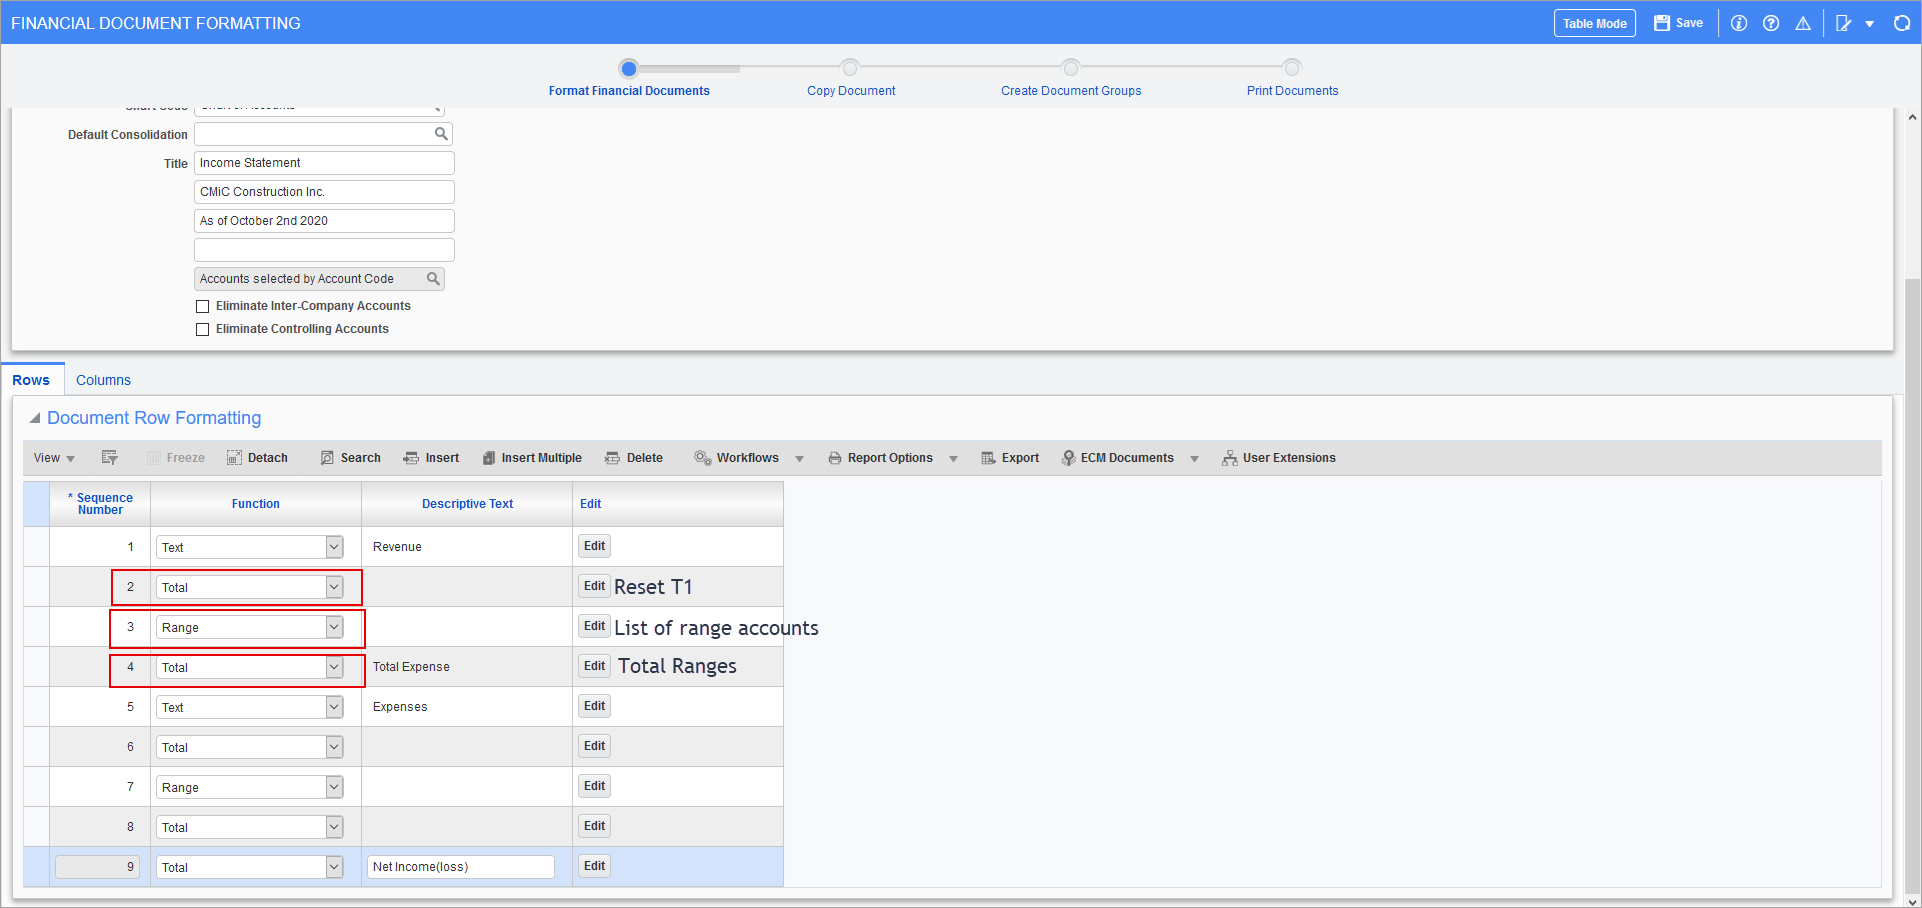
To avoid common setup problems, the layout of the statement should be determined before working with accounting data, and the sequence numbers should be set in multiples of 10 so that rows can be easily inserted should the need arise. Before deciding which accounts to display, create a layout for the document’s Rows by using only text fields, as shown in the following screenshot.
NOTE: To have more viewing area while setting up the layout, click the [Detach] button under the Document Row Formatting section.
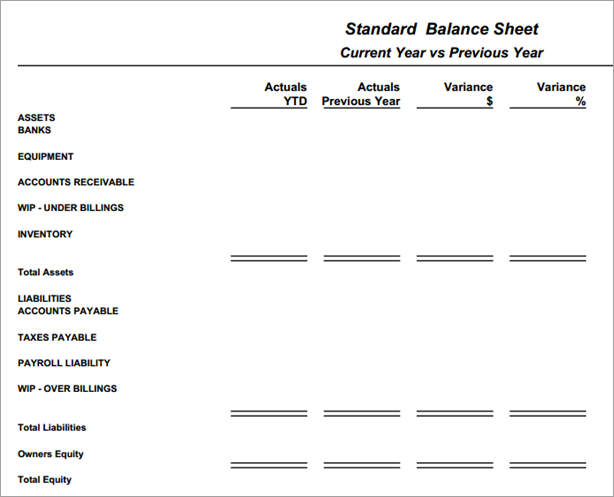
Once the general format has been established, go to the Print Documents process screen, check the ‘Print’ checkbox for the document that was created, and click [Process] to verify the layout:
Part 2: Define Document Header
Pgm: DOCFRM2 – Financial Document Formatting – Document Selection section; standard Treeview path: General Ledger > Reports > Financial Document Formatter
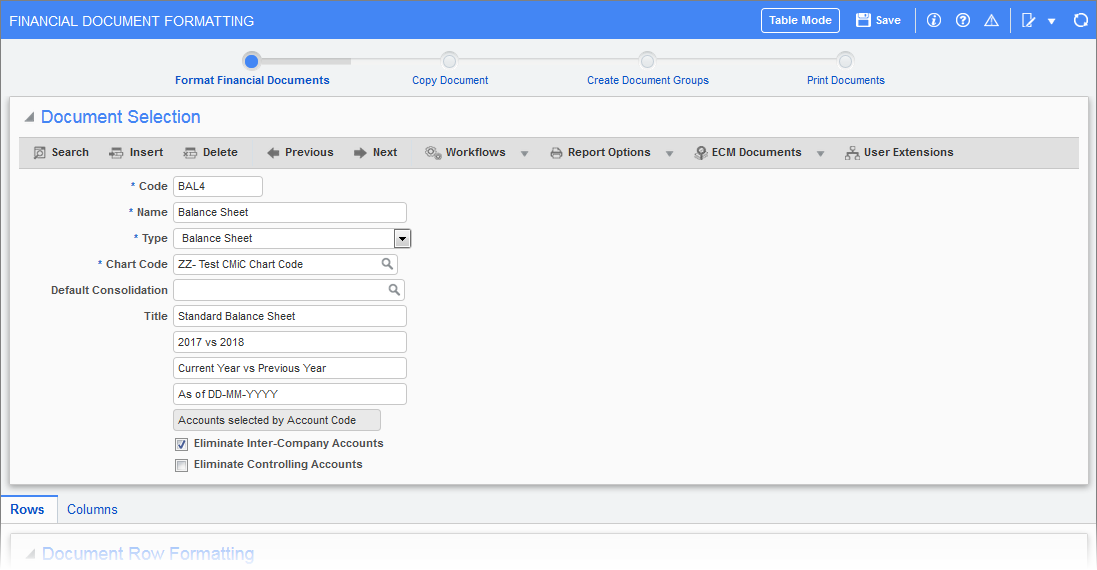
To create a new financial document, click [Add New] along the top of the Financial Document Formatting screen while it is in table mode.
Code
Enter a code that represents the report - this must be a unique code to identify the document.
Name
Enter the working name for the report. The name does not print on the report, but is used to describe and identify the report on the Print Documents screen.
Type
Document types are used to group documents so they can be selected by their type. They are only used to organize documents and are not associated to any pre-defined layouts.
Chart Code
Select the account chart code that this report will be using. The chart code determines the accounts that will be used within the report, and which companies can use the report.
Default Consolidation
Select relevant consolidation code. See the Consolidations Codes section or Detailed Consolidation Codes section for details.
Title
The document’s title is composed of four lines. Enter the heading lines for the top of each page of the document. If date information needs to be included in the title, users can manually enter specific dates in the field, such as “As of 01-06-2023” or “As of June 2023”.
Account Range Selection (not labeled) – Dropdown
To facilitate the selection of accounts to include in the report, you must indicate how you want to select the accounts. The options are as follows:
1. Accounts selected by Sequence Number: select accounts by sequence numbers when building
document; this field automatically defaults to this option
2. Accounts selected by Account Code: select accounts by account numbers when building
document; select this option only when your account numbers and sequence numbers are different,
or if the document will be using individual accounts for calculations
Eliminate Inter-Company Accounts – Checkbox
This checkbox is applicable when the document being created includes a full set of related companies.
Check this box to exclude the inter-company accounts that have their ‘Inter-Company Account’ box checked (checkbox on the Maintain Accounts screen) from documents that consolidate companies with inter-company transactions.
If checked, any account that has the ‘Inter-Company Account’ box checked on the Maintain Accounts screen will not be used when the report is generated.
Leave this box unchecked if the inter-company accounts should be seen on documents that consolidate companies with inter-company accounts.
Eliminate Controlling Accounts – Checkbox
Check the ‘Eliminate Controlling Accounts’ box if low level accounts should only be seen within the financial document that is being created. Leave this field blank if both the control and detail accounts should be seen within the financial document that is being created.
In other words, if the chart of accounts uses controlling accounts, and these should not be seen in the report, then this field should be checked. Controlling accounts allow the user to group like accounts: for example, the user may have a controlling account 1000 for banks and all the different bank accounts may be linked to the controlling account 1000 (controlling accounts do not allow transactions). When this box is checked, the account 1000 will not be included in the document.
Part 3: Document Row Formatting
Pgm: DOCFRM2 – Financial Document Formatting; standard Treeview path: General Ledger > Reports > Financial Document Formatter – Document Row Formatting section – Rows tab
If you think of the report as a spreadsheet, this section is regarding the rows of the sheet. It is where the layout of the report is defined, and the order in which accounts, text, and totals will display.
Each row has a sequence number and a function; the Sequence Number field is used as the row number when printing, and the Function field determines what the row prints. Set sequence numbers in multiples of 10 so that rows can be inserted in between already existing rows should the need arise, since sequence numbers cannot be modified.
Also, to provide much more viewing area, click the [Detach] button on the Block Toolbar to work with the table under the Document Row Formatting section via a large pop-up window.
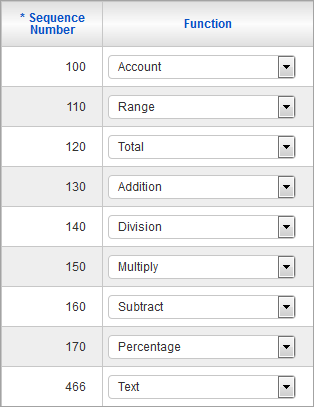
The following table provides details about the options available for the Function field.
|
Text Functions |
|
|
Text |
Print user defined text. |
|
Underline |
Print single underline for each column of the document. |
|
Double Underline |
Print double underline for each column of the document. |
|
Page Break |
Generate page break. |
|
Account Functions |
|
|
Account |
Print single account or range of accounts. |
|
Range |
Print sum of a range of accounts. |
|
Total |
Print total for a series of accounts. |
|
Math Functions |
|
|
Addition |
Print addition of two stored variables. |
|
Division |
Print outcome from the division of two stored variables. |
|
Multiply |
Print outcome of multiplying two stored variables. |
|
Subtract |
Print outcome of subtracting two stored variables. |
|
Percentage |
Print outcome of calculating a percentage of two stored variables. |
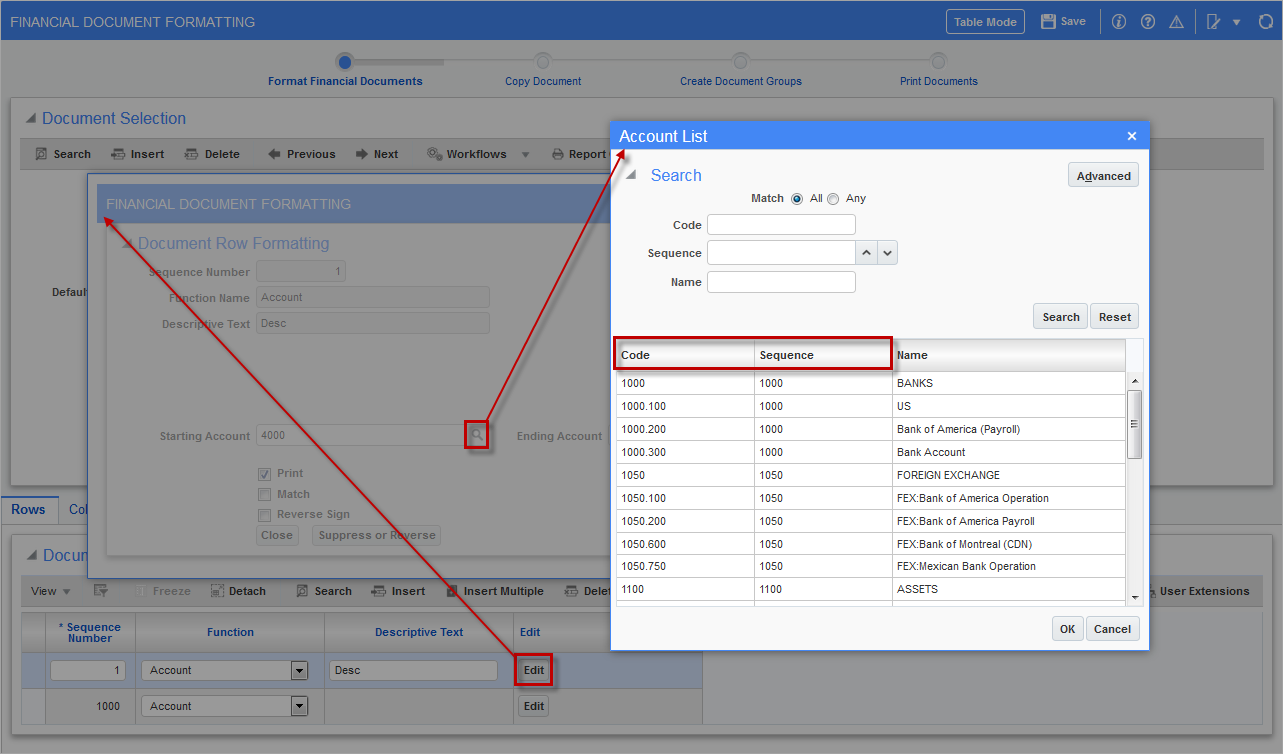
If “Account” or “Range” is selected in the Function field, the [Edit] button on the Document Row Formatting section opens up the Document Row Formatting pop-up window where the user is able to select an account range, as shown in the screenshot below. To facilitate the selection of accounts to include in the report, the user is given two options for the account range selection, select by sequence number or select by account code. Account numbers, by default are displayed in sequential order. If the accounts that will be used for transaction have a sequential set of order, then that sequence number can be selected from the Sequence column in the Account List LOV. If the account numbers and sequence numbers are different, or if the document will be using individual accounts for calculations, then select accounts by account codes using the Code column in the Account List LOV.
NOTE: The Sequence Number field in the Document Row Formatting table, detailed in the Part 3: Document Row Formatting section above, is the sequence number of printing and is not related to the account selected by sequence number in the account range.
Pgm: DOCFRM2 – Financial Document Formatting; standard Treeview path: General Ledger > Reports > Financial Document Formatter – Document Row Formatting section – Rows tab – [Edit] button
Text Row – Creation
Select the Rows tab and click the Block Toolbar’s [Insert Record] button to create a new row. Enter a sequence number, which determines the order of the row. It is best to space them out in case it is necessary to later add in rows in-between two sequences.
Next, select one of the following Function options.
|
Function |
Use |
|---|---|
|
Text |
Used if a heading should be created for a section of the report or a notation should be added in a specific area. |
|
Underline |
This will print a single underline for each column of the document - usually used just before a total row is created. |
|
Double Underline |
Prints a double underline for each column of the document - usually used just after a grand total row has been created. |
|
Page Break |
Generates a page break. |
If “Text” was selected, enter the text that should be printed on the report in the Description field. If any of the other three options were selected, this field can be left blank, if desired, as there is usually no need to print text associated with these other options.
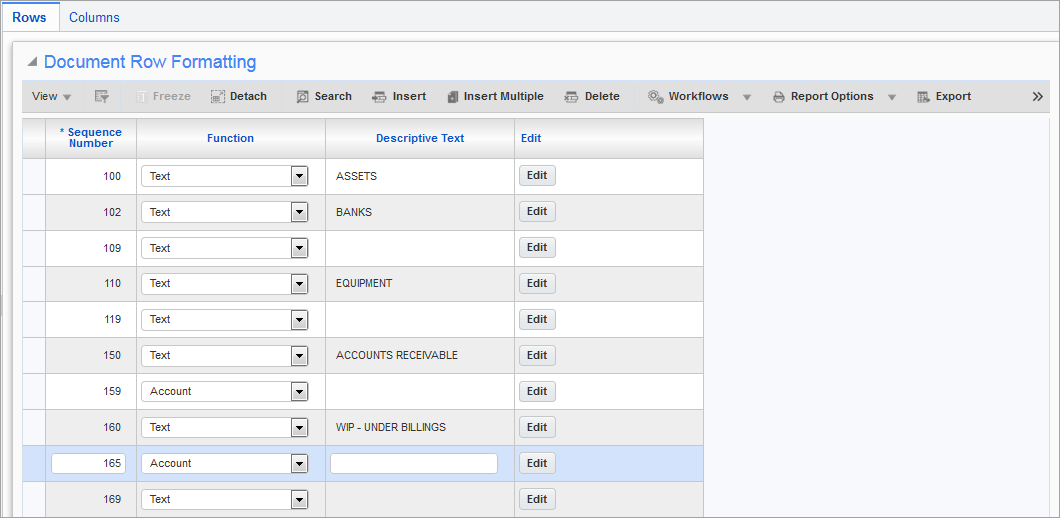
Account Row – Creation
Click [Insert Record] to create a new row and enter a sequence number.
For the Function field, select “Account” to print each account individually, and enter a description regarding the account(s) to be printed. This text will not print on the report, but is useful when reviewing the rows; the actual name of the account(s) will print on the report.
Press the [Edit] button to open the Details pop-up, as shown below:
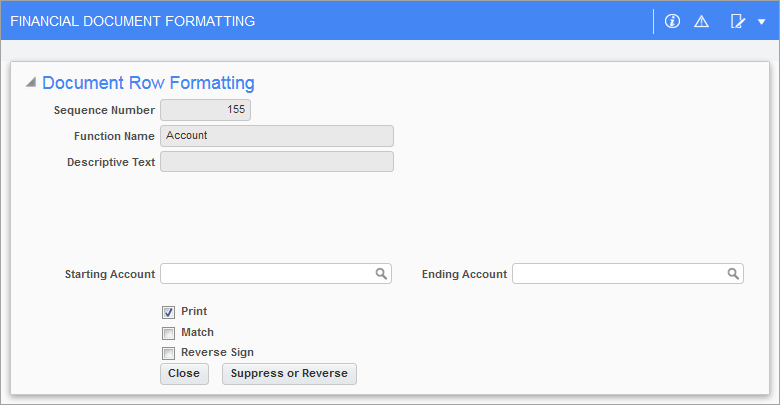
Pgm: DOCFRM2 – Financial Document Formatting – Rows Tab – [Edit] button
Enter the starting and ending accounts for which you want to print details. If these fields are left blank, the first and last accounts are used, and to print the document for a single account, enter the same ending account as the starting account.
Leave the Consolidation Name field blank and the report will use the one defined on the header.
Check Reverse Sign if you want the system to reverse the sign for the amount that will print. This is usually used to reverse credit accounts so that they do not show as negative numbers, e.g. liabilities and revenues.
Close the window and click [Save].
Range of Accounts Row – Creation
Click [Insert Record] to create a new row, and enter a sequence number.
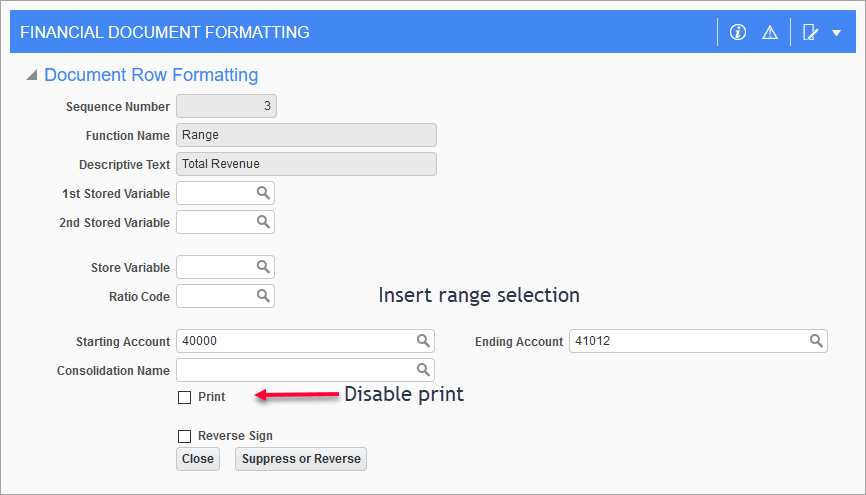
For the Function field, select “Range” to print a range of accounts summed into one line (one amount).
For the Descriptive Text field, enter descriptive text to print as the name for this range of accounts. For example, the user could elect to print all the accounts considered as current receivables as a range - in this case the user may want to name the group as “Current Receivables”.
Next, click the [Edit] button to open the Detail pop-up, as shown below:
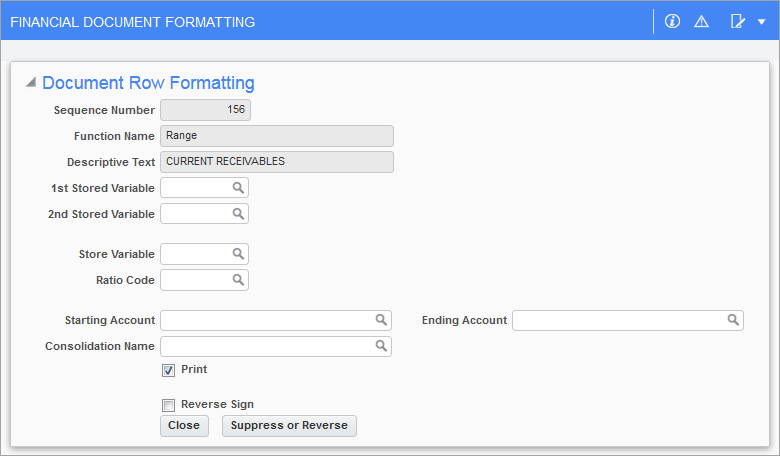
Enter the starting and ending accounts to be grouped as one. If these fields are left blank, the first and last accounts are used.
Check the ‘Reverse Sign’ checkbox if the system should reverse the sign for the amount that will print, then close the window and click [Save].
Total Row – Creation
The system has five running totals that can be used. Each total starts to accumulate from the first row of the report, and only resets to zero each time it is used, therefore the same total can be used more than once.
NOTE: Total 1-6 have been remapped in Financial Document Formatter 2.0. Totals being displayed are 1-5, but in actuality it is Totals 2-6 since total 1 is reserved to store range totals.
In Financial Document Formatter 2.0, Total 1 is mapped to T2, Total 2 is mapped to T3, etc. If working between programs when they sync, the system will align the totals to the right T value.
If a document has a range created in 2.0 and it is opened in 1.0, the system will create a line to clear the total T1, then create a new line for the range with the print flag disabled, then a total line T1 to total the range amount.
We recommend users only use 2.0 as 1.0 is a deprecated product, but if they are going back and forth and modifying in both areas these are some things they can expect.
Click [Insert Record] to create a new row and enter a sequence number.
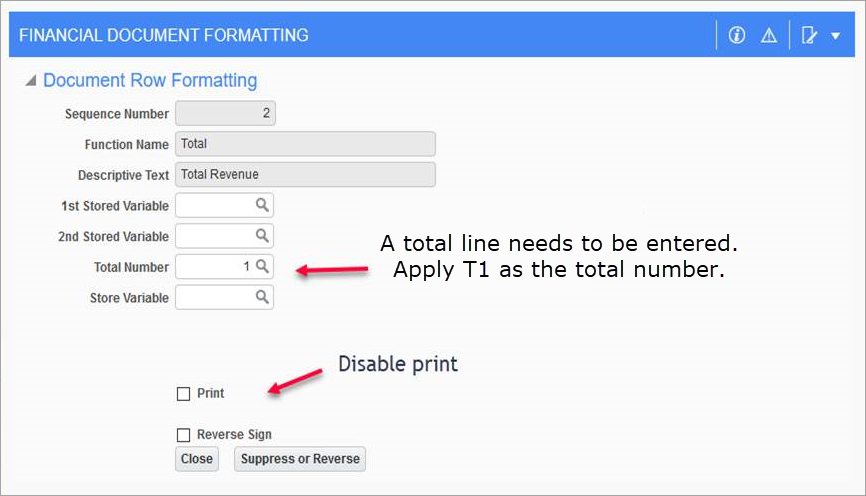
For the Function field, select “Total” to print a total.
For the Descriptive Text field, enter descriptive text for the total. This text will not be printed, but it is useful when reviewing the resetting of total rows.
Next, click [Edit] button to open the Detail pop-up, as shown below:
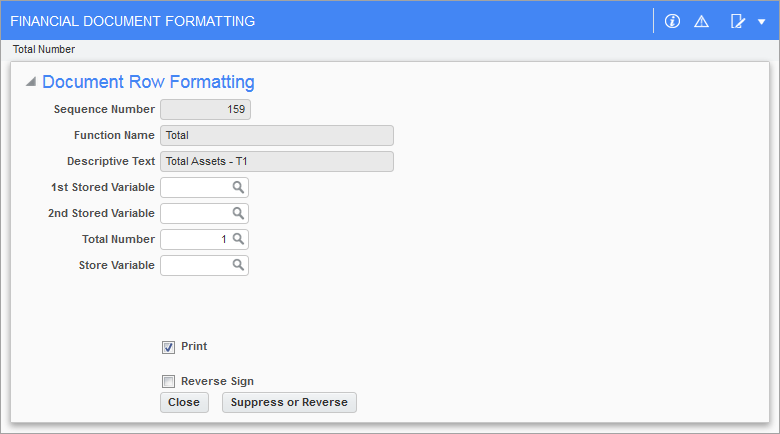
For the Total Number field, enter the total number that should be printed - valid total numbers are 1 through 5.
Check the ‘Reverse Sign if the system should reverse the sign for the amount that will print, then close the window and click [Save].
Simple Example
To demonstrate how totals work, here is how to have three totals, with one total including the two other account range totals.
|
Row 1 |
Text |
Assets |
|
Row 2 |
Account Range |
1000 – 1999 |
|
Row 3 |
Total 1 |
Assets |
|
Row 4 |
Text |
Liabilities |
|
Row 5 |
Account Range |
2000 – 2999 |
|
Row 6 |
Total 2 |
Liabilities |
|
Row 7 |
Text |
Owners/Shareholder’s Equity |
|
Row 8 |
Account Range |
3000 – 3999 |
|
Row 9 |
Total 3 |
Owners/Shareholder’s Equity |
One might think that it is necessary to subtract liabilities from assets, in accordance with the formula A - L = O, but because liabilities have a credit account balance, this is represented by a negative value in our system, and summing the accounts achieves the desired effect.
Reset Total
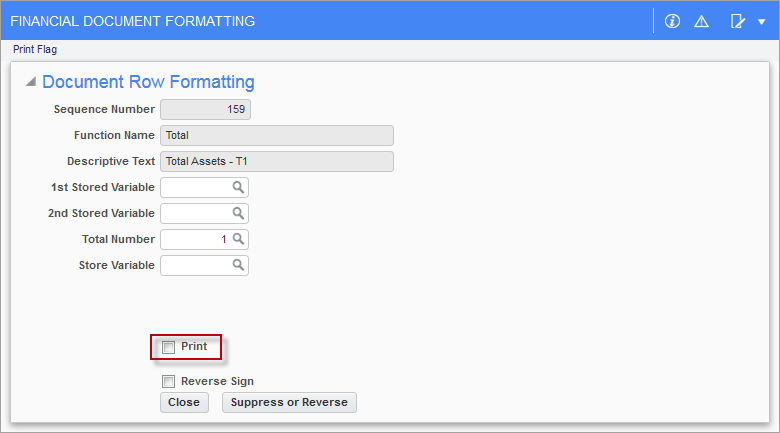
If more than five total lines are needed, a total can be reset to zero. Follow the steps in the previous section, Total Row - Creation, but uncheck the ‘Print’ checkbox. This will tell the system that the total should be reset to zero, but not print it on the report.
Example: Reset a Total
|
Row 1 |
Text |
Assets |
|
⁞ |
⁞ |
⁞ |
|
Row 20 |
Total 5 |
|
|
Row 21 |
Total 1 |
set Total 1 to not print to reset it to zero |
|
Row 22 |
Account Range |
6000 – 6999 |
|
Row 23 |
Total 1 |
this will total the above account range |
Part 4: Document Column Formatting
Document columns define the type of data that is to be printed in the columns of the document.
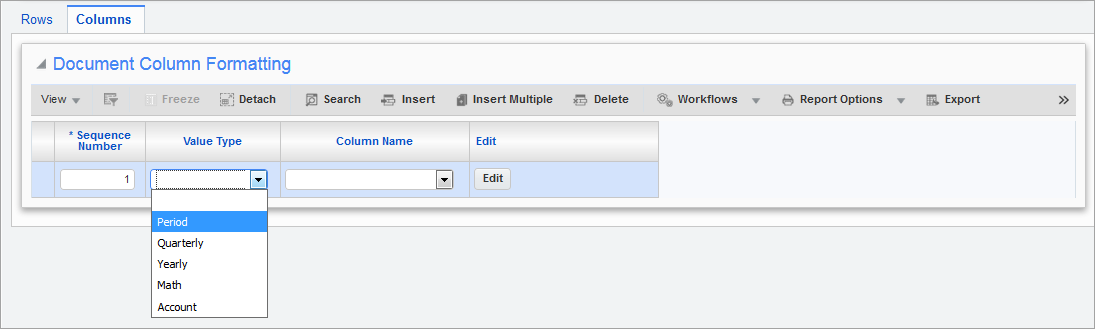
A column’s Sequence Number determines its order when printing, and is used as the row number. A column’s Value Type declares its data type, which can be Period, Quarterly, Yearly, or Account financial data, or data calculated via a Math function.
The following table provides descriptions about the options available for the Value Type (types of functions) field. For information about the options for the Column Name field, please refer to the relevant section.
| Value Types (Function Types) | |
|---|---|
|
Period |
Generate financial data for current period. |
|
Quarterly |
Generate quarterly financial data. |
|
Yearly |
Generate yearly financial data. |
|
Math |
Perform mathematical operation on two column values. |
|
Account |
Print account numbers for the column, except for account numbers where range option to sum multiple accounts has been used. |
Period Financial Data Column – Creation
The following table provides descriptions about the options available for the Column Name field, for the “Period” function type selected via the Value Type field:
| Column Name – Field (Functions) | |
|---|---|
|
Current Period Balance |
Period balance for current period. |
|
Current Period Budget |
Budget for current period. |
|
Specific Period Balance |
Balance for specific period. |
|
Specific Period Budget |
Budget for specific period. |
|
PRPERIOD Current Balance |
Previous period balance. |
|
PRYR Current Period Balance |
Pervious year current period balance. |
To define a new column, click [Insert Record] on the Columns tab’s Block Toolbar.
Enter a Sequence Number for the column, and select Period for its Value Type. For the Col Name field, select the type of period data.
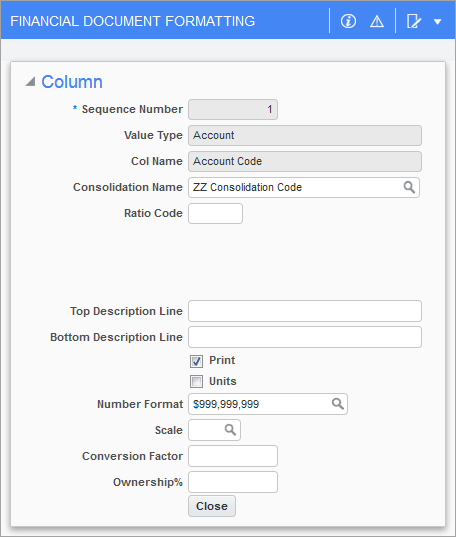
Next, click [Edit] to open the Detail pop-up, shown below:
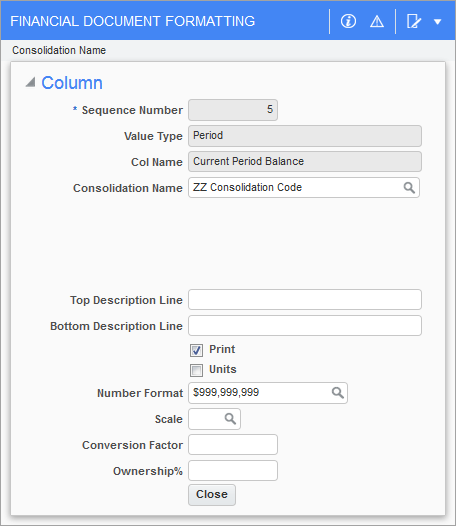
The fields shown on the Detail pop-up window depends on the type of period financial data selected via the Col Name field. The following table provides details about the editable fields in this window for all the period data types selected for the Col Name field.
| Field | Available for Following Col Name Values | Description |
|---|---|---|
|
Consolidation Name |
ALL |
Select consolidation code to specify relevant companies and departments for column. |
|
Budget Code |
Current Period Budget, Specific Period Budget |
Select relevant budget code to use. |
|
Year |
Specific Period Budget, Specific Period Balance |
Select year the period is in. |
|
Period |
Specific Period Budget, Specific Period Balance |
Select the desired period. |
|
Top Description Line |
ALL |
Enter top (primary) title for the column. |
|
Bottom Description Line |
ALL |
Enter bottom (secondary) title for column. |
|
Print – Checkbox |
ALL |
If unchecked, column hidden when printing. |
|
Units – Checkbox |
ALL |
Check if instead of dollar amounts, this column’s value represents unit amounts. |
|
Number Format |
ALL |
Select number format for column’s value. |
|
Scale |
ALL |
Select printing scale for column’s value; the following illustrates how a value of 1,000,000 is displayed for each code: CODE SCALE APPEARANCE 1 1 1,000,000 |
|
Conversion Factor |
ALL |
If you have two companies that operate with different currencies, for example US dollars and euros, a conversion factor can be applied to the column that prints the euro based company so that the numbers can be viewed in approximate US dollars. |
|
Ownership% |
ALL |
This can be used if the books are being kept for a joint venture, but only the company’s own percent of the amounts are needed to be viewed. If a percent is entered in this field, the report will print this percent of the actual amount. NOTE: Currency conversion factors are calculated before the ownership percent is applied. |
Quarterly Financial Data Column – Creation
The following table provides descriptions about the options available for the Column Name field, for the “Quarterly” function type selected via the Value Type field:
|
Column Name |
Field (Functions) |
|---|---|
|
QTD Balance |
Activity for the current quarter. |
|
QTD Budget |
Current quarter budget. |
|
Specific QTD Balance |
Specific quarter balance; period entered used to determine quarter. |
|
Specific QTD Budget |
Specific quarter budget. |
|
PRQTD Balance |
Previous quarter balance. |
|
PRYR QTD Balance |
Previous year quarter balance. |
To define a new column, click the [Insert Record] button., on the Columns tab’s Block Toolbar.
Enter a Sequence Number for the column, and select “Quarterly” for its Value Type. For the Col Name field, select the type of quarterly data.
Next, click [Edit] to open the Detail pop-up, shown below:
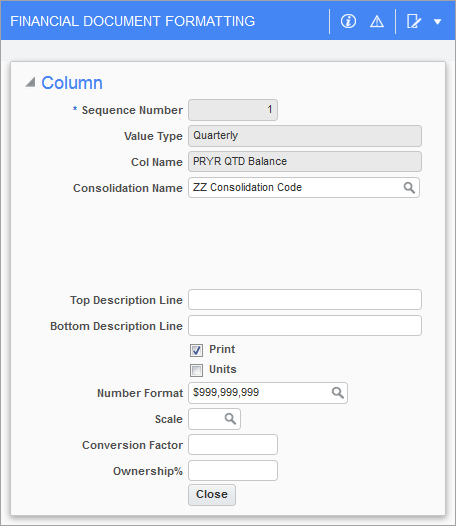
The fields shown on the Detail pop-up depend on the type of quarterly financial data selected via the Col Name field. The following table provides details about the editable fields in this window for all the quarterly data types selected for the Col Name field:
| Field | Available for Following Col Name Values | Description |
|---|---|---|
|
Consolidation Name |
ALL |
Select consolidation code to specify relevant companies and departments for column. |
|
Budget Code |
QTD Budget, Specific QTD Budget |
Select relevant budget code to use. |
|
Year |
Specific QTD Budget, Specific QTD Balance |
Select year the period is in. |
|
Period |
Specific QTD Budget, Specific QTD Balance |
Select the desired period. |
|
Top Description Line |
ALL |
Enter top (primary) title for the column. |
|
Bottom Description Line |
ALL |
Enter bottom (secondary) title for column. |
|
Print – Checkbox |
ALL |
If unchecked, column hidden when printing. |
|
Units – Checkbox |
ALL |
Check if instead of dollar amounts, this column’s value represents unit amounts. |
|
Number Format |
ALL |
Select number format for column’s value. |
|
Scale |
ALL |
Select printing scale for column’s value; the following illustrates how a value of 1,000,000 is displayed for each code: CODE SCALE APPEARANCE 1 1 1,000,000 |
|
Conversion |
ALL |
If there are two companies that operate with different currencies, for example US dollars and euros, a conversion factor can be applied to the column that prints the euro based company so that the numbers can be viewed in approximate US dollars. |
|
Ownership% |
ALL |
This can be used if the books are being kept for a joint venture, but only the company’s own percent of the amounts are needed to be viewed. If a percent is entered in this field, the report will print this percent of the actual amount. NOTE: Currency conversion factors are calculated before the ownership percent is applied. |
Yearly Financial Data Column – Creation
The following table provides descriptions about the options available for the Column Name field for the “Yearly” function type selected via the Value Type field:
|
Column Name |
Field (Functions) |
|---|---|
|
YTD Balance |
Year to date balance. |
|
YTD Budget |
Year to date budget. |
|
Specific YTD Balance |
Specific year balance. |
|
Specific YTD Budget |
Specific year budget. |
|
PRPERIOD YTD Balance |
Previous period year to date balance. |
|
Prior yr period balance |
Previous year period balance. |
|
Prv Yr End M.T.D |
Previous year-end month-to-date. |
|
Prv Yr End Balance |
Previous year-end balance. |
|
Prv Yr End Q.T.D |
Previous year end quarter-to-date. |
To define a new column, click the [Insert Record] button on the Columns tabs’ Block Toolbar.
Enter a Sequence Number for the column and select “Yearly” for its Value Type. For the Col Name field, select the type of yearly data.
Next, click [Edit] to open the Detail pop-up shown below:
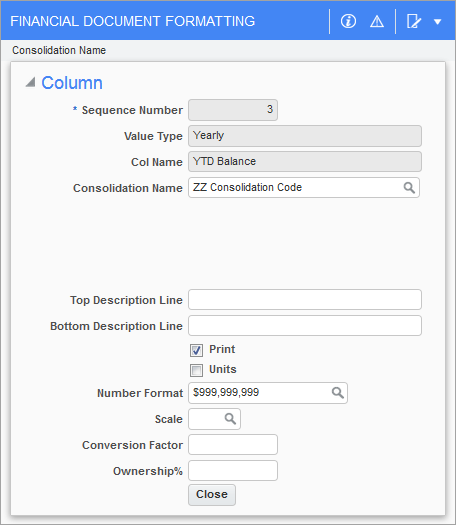
The fields shown on the Detail pop-up depend on the type of yearly financial data selected via the Col Name field. The following table provides details about the editable fields in this window for all the yearly data types selected for the Col Name field:
| Field | Available for Following Col Name Values | Description |
|---|---|---|
|
Consolidation Name |
ALL |
Select consolidation code to specify relevant companies and departments for column. |
|
Budget Code |
YDT Budget, Specific YDT Budget |
Select relevant budget code to use. |
|
Year |
Specific YDT Budget, Specific YDT Balance |
Select year the period is in. |
|
Period |
Specific YDT Budget, Specific YDT Balance |
Select the desired period. |
|
Top Description Line |
ALL |
Enter top (primary) title for the column. |
|
Bottom Description Line |
ALL |
Enter bottom (secondary) title for column. |
|
Print – Checkbox |
ALL |
If unchecked, column hidden when printing. |
|
Units – Checkbox |
ALL |
Check if instead of dollar amounts, this column’s value represents unit amounts. |
|
Number Format |
ALL |
Select number format for column’s value. |
|
Scale |
ALL |
Select printing scale for column’s value; the following illustrates how a value of 1,000,000 is displayed for each code: CODE SCALE APPEARANCE 1 1 1,000,000 |
|
Conversion Factor |
ALL |
If there are two companies that operate with different currencies, for example US dollars and euros, a conversion factor can be applied to the column that prints the euro based company so that the numbers can be viewed in approximate US dollars. |
|
Ownership% |
ALL |
This can be used if the books are being kept for a joint venture, but only the company’s own percent of the amounts are needed to be viewed. If a percent is entered in this field, the report will print this percent of the actual amount. NOTE: Currency conversion factors are calculated before the ownership percent is applied. |
Math Column – Creation
The following table provides descriptions about the options available for the Column Name field for the “Math” function type selected via the Value Type field:
|
Column Name |
Field (Functions) |
|---|---|
|
Addition |
Add value of two columns together |
|
Division |
Divide the amount in one column by the amount in another. If column 1 contained the number of units produced and column 2 contained the individual expense amounts, column 3 could divide column 1 by column 2 to return a cost/unit for each expense category. |
|
Multiply |
Multiply the amount in one column by the amount in another. If column 1 contained amounts and column 2 contained percentages, column 3 could multiply columns 1 by column 2 to return the amount represented by the percentage. |
|
Percent Variance |
Calculate the percentage of one column in relation to another. If column 1 contains budget amounts and column 2 contains actual amounts, column 3 could calculate the percentage of budget represented by the actual amounts. |
|
Ratio |
To calculate ratios on a row amount, a ratio code must be defined to be used within the calculation. The ratio percentage will calculate the ratio of each row value on all rows based on the total amount in the store variable applied on the ratio code. Please see the Setting Up the Math Ratio Function section for more details. The Calculation Column fields are used to define which column the ratio will be calculated on. Both calculation columns need to be set in order to generate the ratio percentage. |
|
$Variance |
Displays the difference between the amount in one column and the amount in another. If column 1 contains amounts for one company and column 2 contains amounts for another company, column 3 could show the variance (difference) between the amounts in column 1 and column 2. |
To define a new column, click the [Insert Record] on the Columns tab’s Block Toolbar.
Enter a Sequence Number for the column and select Math for its Value Type. For the Col Name field, select a math function.
Next, click [Edit] to open the Detail pop-up, shown below:
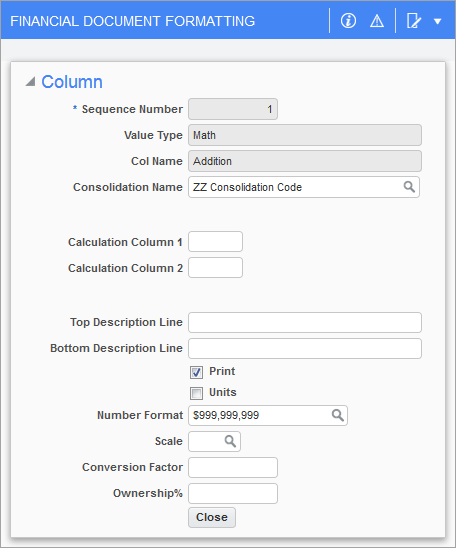
The following table provides details about the editable fields in this window.
| Field | Available for Following Col Name Values | Description |
|---|---|---|
|
Consolidation Name |
ALL |
Select consolidation code to specify relevant companies and departments for column. |
|
Budget Code |
YDT Budget, Specific YDT Budget |
Select relevant budget code to use. |
|
Year |
Specific YDT Budget, Specific YDT Balance |
Select year the period is in. |
|
Period |
Specific YDT Budget, Specific YDT Balance |
Select the desired period. |
|
Top Description Line |
ALL |
Enter top (primary) title for the column. |
|
Bottom Description Line |
ALL |
Enter bottom (secondary) title for column. |
|
Print – Checkbox |
ALL |
If unchecked, column hidden when printing. |
|
Units – Checkbox |
ALL |
Check if instead of dollar amounts, this column’s value represents unit amounts. |
|
Number Format |
ALL |
Select number format for column’s value. |
|
Scale |
ALL |
Select printing scale for column’s value; the following illustrates how a value of 1,000,000 is displayed for each code: CODE SCALE APPEARANCE 1 1 1,000,000 |
| Mask | ALL | Select number format for column’s value. |
|
Conversion Factor |
ALL |
If there are two companies that operate with different currencies, for example US dollars and euros, a conversion factor can be applied to the column that prints the euro based company so that the numbers can be viewed in approximate US dollars. |
|
Ownership% |
ALL |
This can be used if the books are being kept for a joint venture, but only the company’s own percent of the amounts are needed to be viewed. If a percent is entered in this field, the report will print this percent of the actual amount. NOTE: Currency conversion factors are calculated before the ownership percent is applied. |
Account Numbers Column – Creation
This function prints the account numbers for the column except for account numbers where the “Range” option to sum multiple accounts has been used. There is only one function available for the Value Type (function type) of account, being account code.
To define a new column, click the [Insert Record] button, on the Columns tab’s Block Toolbar, to create a new column.
Enter a Sequence Number for the column, and select Account for its Value Type. For the Col Name field, select Account Code.
Next, click [Edit] to open the Detail pop-up, shown below:
The following table provides details about the editable fields in this window.
| Field | Available for Following Col Name Values | Description |
|---|---|---|
|
Consolidation Name |
ALL |
Select consolidation code to specify relevant companies and departments for column. |
|
Budget Code |
YDT Budget, Specific YDT Budget |
Select relevant budget code to use. |
|
Year |
Specific YDT Budget, Specific YDT Balance |
Select year the period is in. |
|
Period |
Specific YDT Budget, Specific YDT Balance |
Select the desired period. |
|
Top Description Line |
ALL |
Enter top (primary) title for the column. |
|
Bottom Description Line |
ALL |
Enter bottom (secondary) title for column. |
|
Print – Checkbox |
ALL |
If unchecked, column hidden when printing. |
|
Units – Checkbox |
ALL |
Check if instead of dollar amounts, this column’s value represents unit amounts. |
|
Number Format |
ALL |
Select number format for column’s value. |
|
Scale |
ALL |
Select printing scale for column’s value; the following illustrates how a value of 1,000,000 is displayed for each code: CODE SCALE APPEARANCE 1 1 1,000,000 |
| Mask | ALL | Select number format for column’s value. |
|
Conversion Factor |
ALL |
If there are two companies that operate with different currencies, for example US dollars and euros, a conversion factor can be applied to the column that prints the euro based company so that the numbers can be viewed in approximate US dollars. |
|
Ownership% |
ALL |
This can be used if the books are being kept for a joint venture, but only the company’s own percent of the amounts are needed to be viewed. If a percent is entered in this field, the report will print this percent of the actual amount. NOTE: Currency conversion factors are calculated before the ownership percent is applied. |
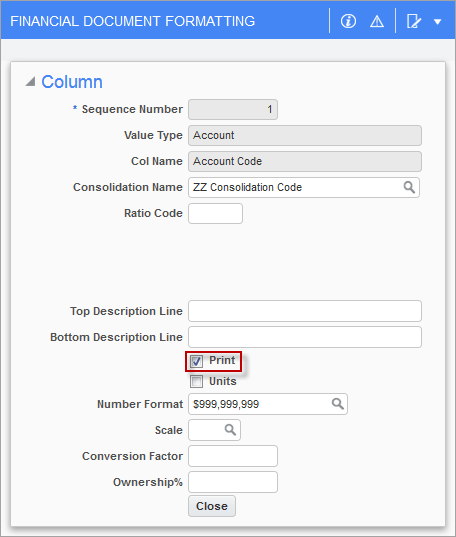
Hide a Column
Sometimes it is necessary to create a column whose only purpose is to be used within a math function. This can be done by unchecking the ‘Print’ box on the Details pop-up window (launched by clicking the column’s [Edit] button, on the Columns tab of the main screen).
Part 5: Hide Specific Cells or Reverse Sign (Optional)
Sometimes it is necessary to hide a specific cell, or in other words, a specific row’s column (column headings and row descriptions will still appear).
For example, if showing calculated ratios for a couple accounts, it may be necessary to hide other ratios to not clutter up the ratio column.
As another example, there may be a column that displays a dollar rate per unit. In a previous column, the dollar amount is displayed, and in another, the unit represented by those dollars. The rate per unit will be valuable information for expenses and revenue accounts, but may be less meaningful for certain asset and liability accounts. This can be used to prevent a rate per unit figure from appearing for those accounts.
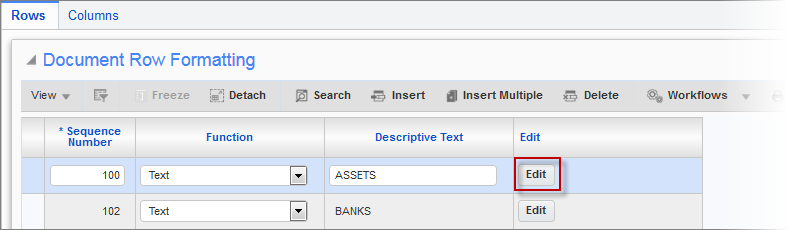
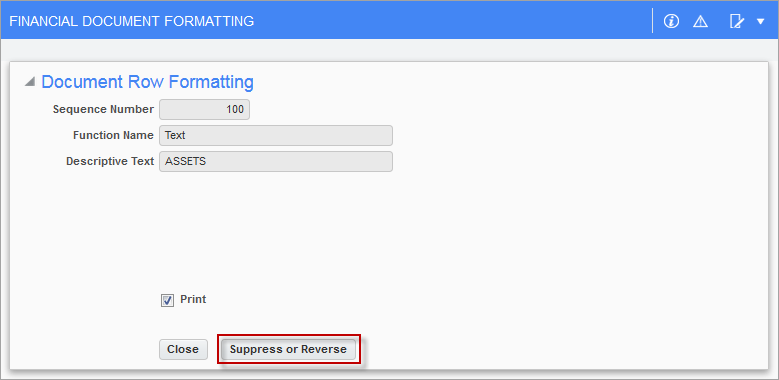
To hide a specific cell, first click the row (on the main screen). Then, click the relevant row’s [Edit] button (shown above) to launch the Details pop-up window. In this window, sample shown below, click [Suppress or Reverse].
In the following pop-up window, sample shown below, click the Block Toolbar’s [Insert] button to insert a new row. For the Column field, select the relevant column, and for the Line Number field, select the relevant row’s Sequence Number.
The following screenshot shows a set up that hides line 103 in column 4:
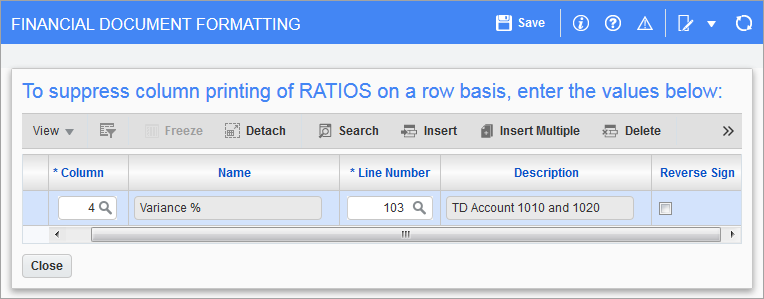
However, if the ‘Reverse Sign’ box is checked (far right column), the cell will not be hidden. Instead, its value is reversed.
The purpose of this functionality was to allow users to display variance, whether as a percentage or dollar amount, in opposite ways. For example, if there is $1000 budgeted for revenue, and $1000 budgeted for expenses, then if the actuals are $900 for both revenue and expenses, per a simple calculation, there is -$100 variance and -10% variance. However, -$100 for expenses is a good thing. Therefore, some users reverse the sign for variance against credit normal balance accounts.
How to Use Math Functions
Step 1 – Create Stored Variables for Calculations
Math functions operate on stored variables. If subtracting, adding, or multiplying accounts, the account amounts must first be stored in variables.
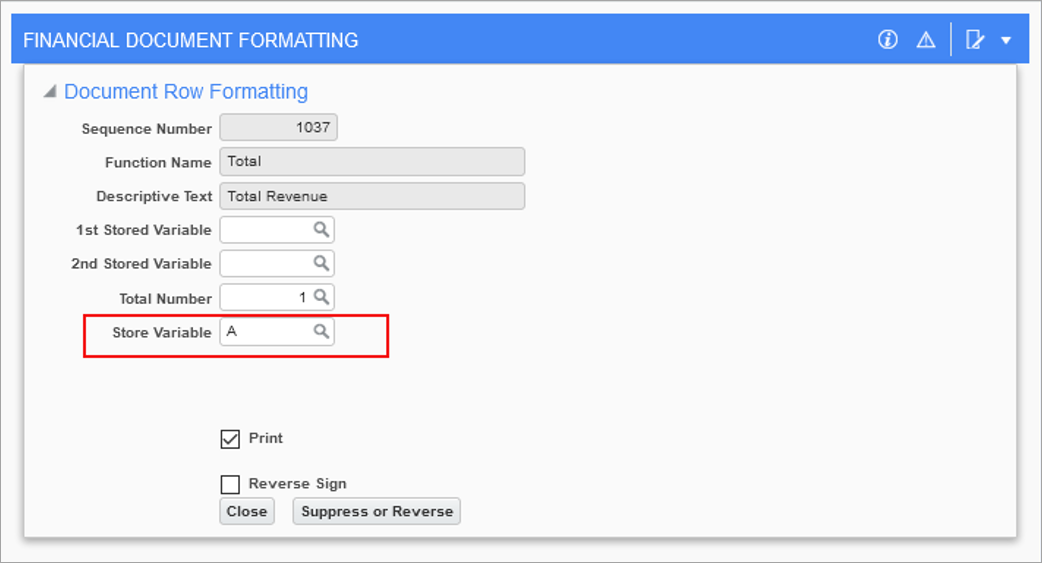
As listed in the below screenshot, any row with the function total, range, account, or with any math function, can have its associated amount saved in a stored variable.
Find the first row that you want to store in a variable and click [Edit] to open the Detail pop-up, shown below:
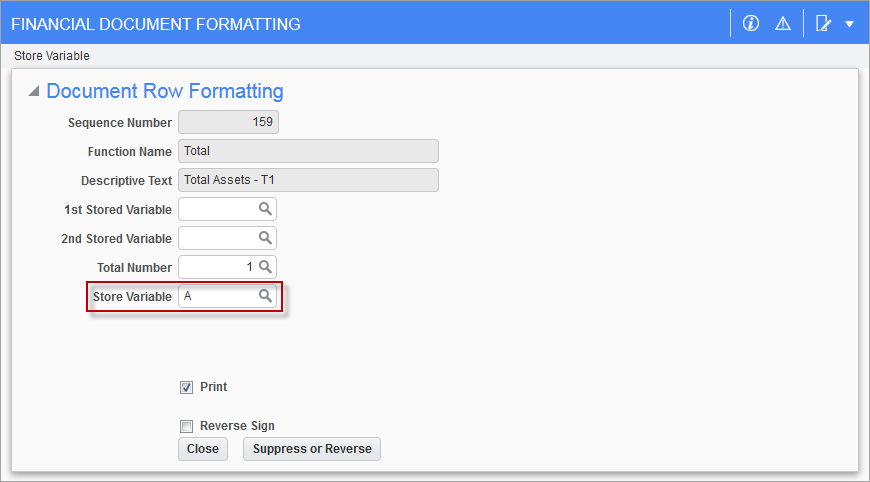
There are 10 stored variables that can be used: A, B, C, D, E, F, G, H, I, and J. Enter a variable in the Store Variable field. Each time a variable is assigned, it is reset.
Find the second row that should be stored in a variable and enter a different variable for the Store Variable field. Close the window and click [Save].
Step 2 – Create Math Row Using Stored Variables
Click [Insert Record] to create a new row. Verify that the sequence number of the new row is correct and change it if necessary (sequence number determines the order of the row).
Select the type of math function required: addition, division, subtraction, etc. Enter descriptive text that should be seen on the report about what is being printed. Press the [Edit] button to open the Detail pop-up.
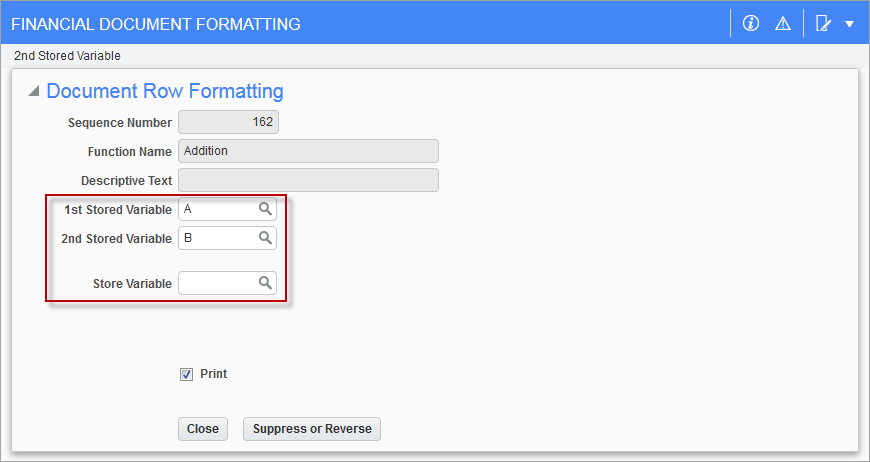
For the 1st Stored Variable and 2nd Stored Variable fields, enter the two variables created in step one. The order in which the variables are entered will make a difference for the division and percentage functions.
If the output of this function should also be saved so it can be used by another function, enter a 3rd variable in the Store Variable field.
Close the window and click [Save].
Setting Up the Ratio Math Function
To calculate ratios on a row amount, a store variable must be defined to be used within the calculation. For example, Total A contains Total Revenue. The ratio percentage will calculate the ratio of each row value on all rows based on the total amount in the store variable applied on the ratio code.
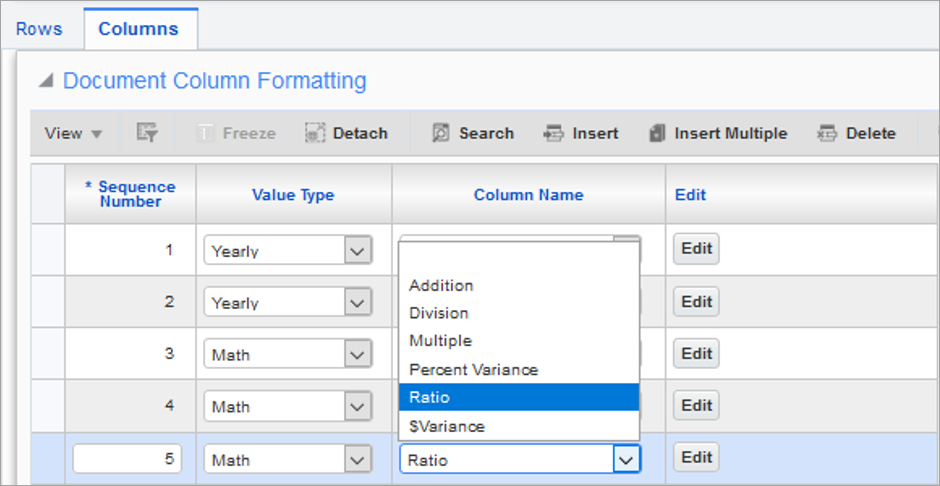
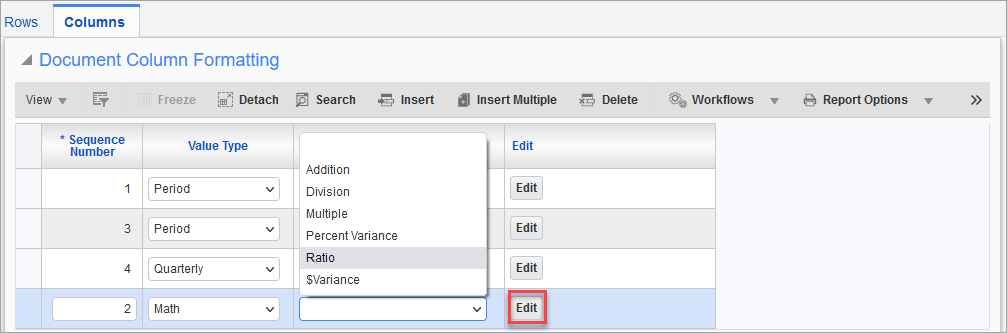
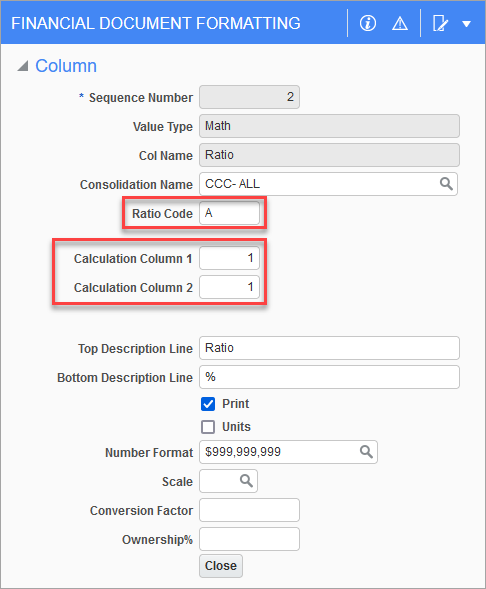
In the Column definition, set the Value Type field to "Math" and "Ratio" for the Column Name field.
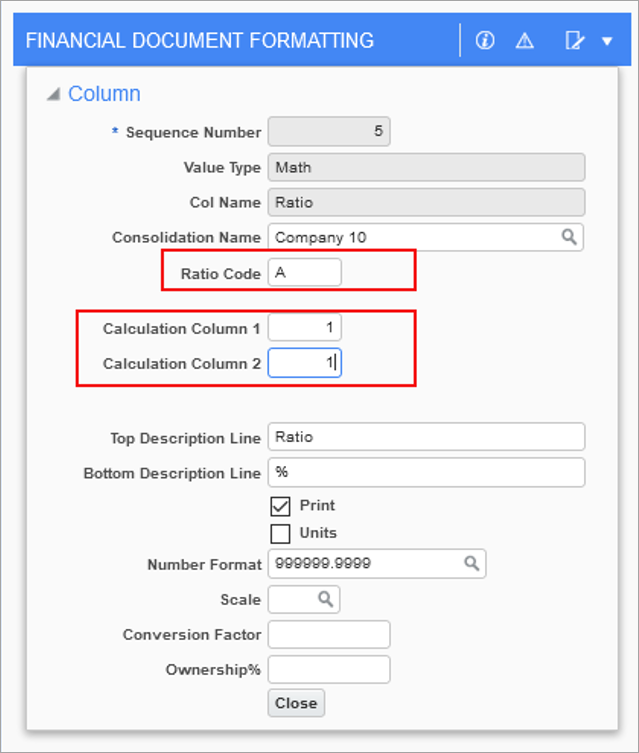
Click on the [Edit] button to open the Column Details pop-up window, enter the Ratio Code (Store Variable). The ratio entered in this field will be used in the calculation of each row amount to generate a ratio percentage.
The Calculation Column fields are used to define which column the ratio will be calculated on. For example, indicating "1" as the column number will apply the ratio based on the amount associated to Column 1. If the ratios are to calculate using the values in Column 2 then input "2" in the Calculation Column fields.
Both calculation columns need to be set in order to generate the ratio percentage.
Setting Up Range Mapping Between 1.0 and 2.0
The range mapping in Financial Document Formatter 1.0 needs to follow this structure in order to map to 2.0. Total 1 is used to store ranges within the database by default.
Whenever a range is used, Total 1 needs to be cleared:
-
In the [Edit] button pop-up window, set the Total Number field value to “1”. The ‘Print’ box must be unchecked.
When creating a range, the following must be applied:
-
Range 1 (From and To Account values) - The ‘Print’ box must be unchecked.
-
Range 2 (From and To Account values) - The ‘Print’ box must be unchecked.
-
Range 3 (From and To Account values) - The ‘Print’ box must be unchecked.
To calculate a total of range that has been entered:
-
Set Total Number to “1”.
-
T1 will display the description field value, e.g. Total Revenue. The ‘Print’ box must be checked.
Setting Up the Ratio Math Function
To calculate the ratio of an amount, the user will store the ratio code on a row using the range function. This value will then be divided by each row within a specified column to get the ratio percentage.
A ratio code is defined on the range function rows. The user can select a code from A to E from a list of values (LOV) to store a ratio code. The ratio code will hold the total amount of the range accounts defined, and the amount will be used as the denominator in the calculation to get a percentage.
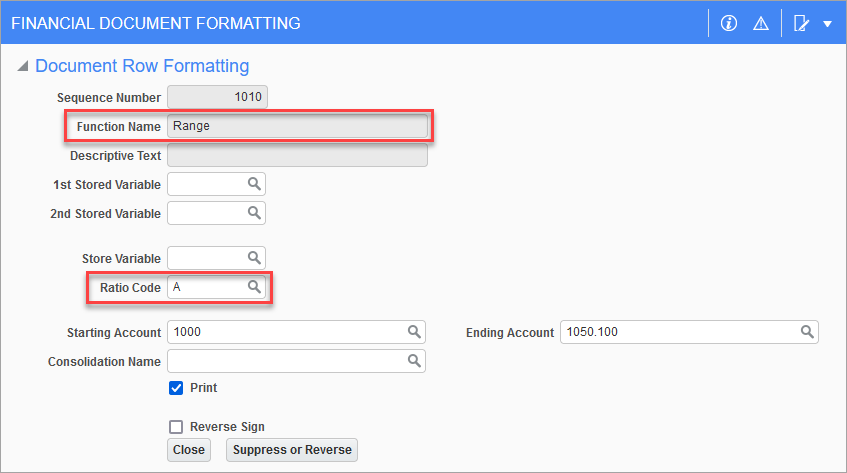
For example, if ratio code A is defined on the row, the user will define which column the ratio row amount will be generated from. The user will then select the column to be used as the numerator to calculate the amount on each row to get the ratio percentage. See the sample screenshots of the column setup below.
In the column formatting, the Value Type field is set to "Math" and the Column Name field must be set to "Ratio". The user must then select the [Edit] button.
In edit mode, enter the ratio code entered on the range. The Calculation Column fields will have a LOV which will display the current columns defined on the report. The Calculation Column 1 field is the numerator, and the Calculation Column 2 field is the denominator for the amount stored in the ratio code.
Scenario
Ratio Code A = Range of Revenue accounts
Column 1 = YTD Budget
Column 2 =YTD Balance
Column 3 = Prior Year MTD Balance
Example
The Calculation Column 1 = Column 2 YTD Balance
YTD Balance amount on all rows is defined on the report as the numerator in the calculation.
Calculation Column 2 = Column 3 Prior Year MTD Balance
Prior Year MTD Balance total for the Range of Accounts is stored as the denominator in the calculation.
NOTE: The calculated columns identify the column data used for the calculation. In this example Calculated Column 2 is where the ratio amount is generated from as the ratio is the denominator. The column selected is Prior Year MTD Balance, so the calculation will be the total amount on the range of accounts stored in Ratio Code A for that column.