Toolbar – Controls
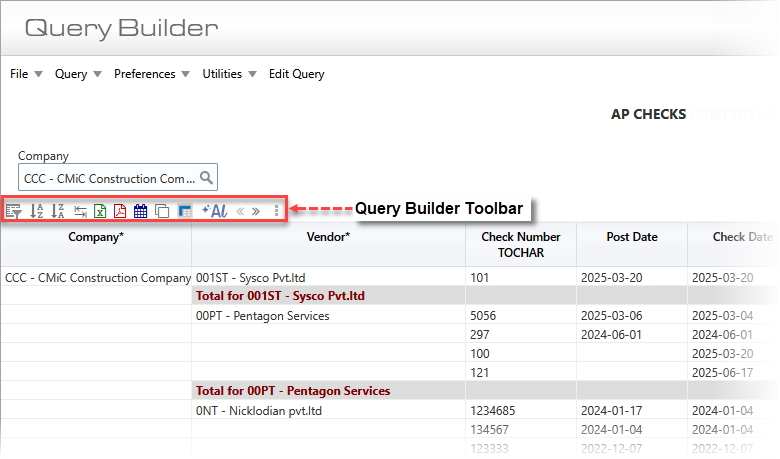
Query Builder with toolbar controls framed in red
The following toolbar controls are available in BI Query Builder.

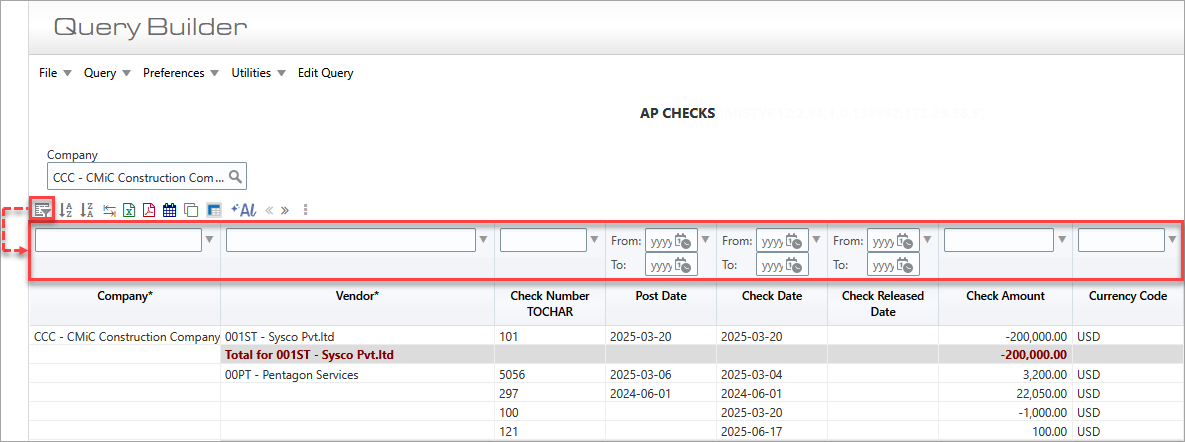
A filter icon is available to Query by Example (QBE).
When the icon is clicked, a row of fields appears above the table column headers for the user to enter QBE expressions for each of the table’s columns.
For more details on comparison and logical operators available to use in the expression fields for String, Number and Date columns, refer to Query By Example (QBE).

This option aligns the table’s sort order to the order of the columns and sorts the table’s columns in ascending order.
For more details, refer to Sort Ascending.

This option aligns the Table’s sort order to the order of the columns and sorts the Table’s columns in descending order.
For more details, refer to Sort Descending.
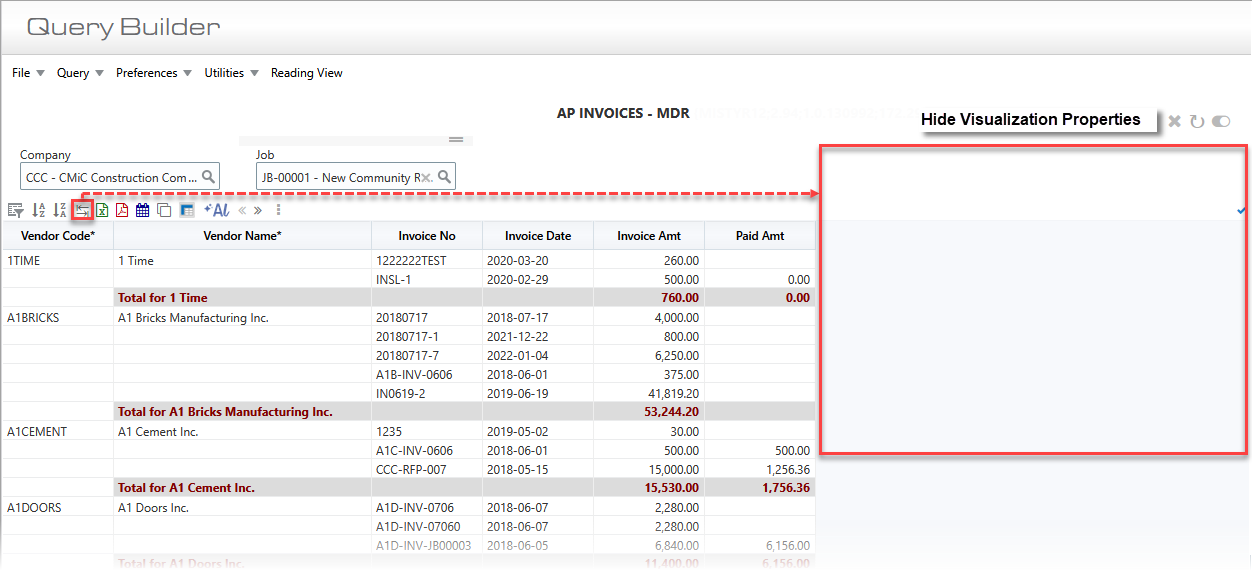
Show/Hide Visualization Settings 
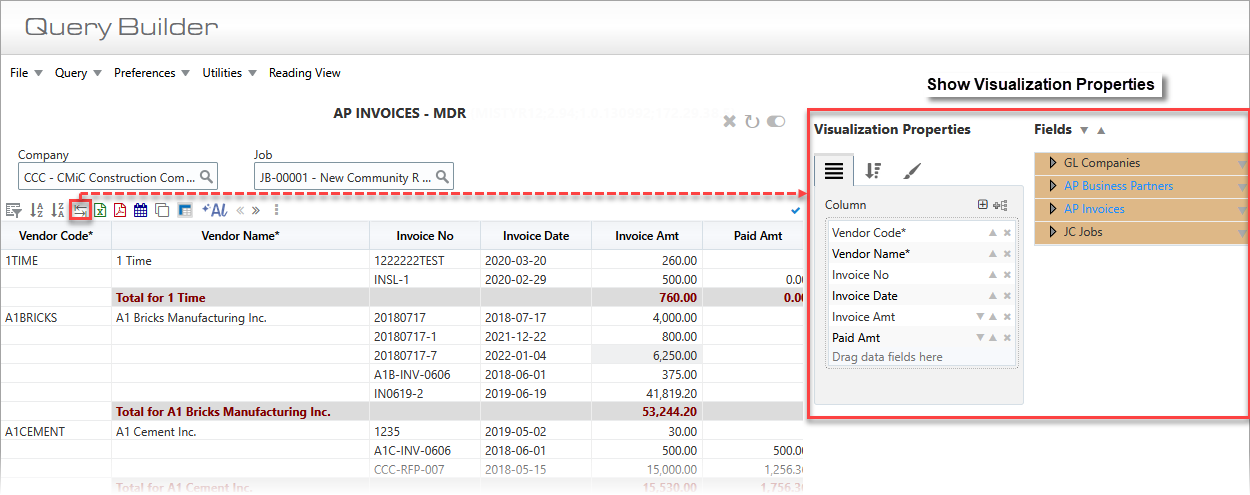
This option is used to show/hide the query’s visualization settings.

An Excel icon is available to export the query to an Excel spreadsheet.
For more details, refer to Export Table to Excel.

A PDF icon is available to export the query to a PDF file.
For more details, refer to Export Table to PDF.
A Schedule Export icon is available to configure when and how reports are distributed. Whether you’re setting up a single report for month-end delivery or automating daily operational updates, the scheduler makes it easy to stay on top of reporting needs without manual intervention.
To use this feature, users require the system privilege 'BISCHDEXPT - CMiC BI: Allows the user to schedule data exports'. For details on assigning privileges, refer to BI Dashboard Builder - Assigning System Privileges. Once the appropriate privilege is granted, users can schedule reports to be delivered in their preferred format.
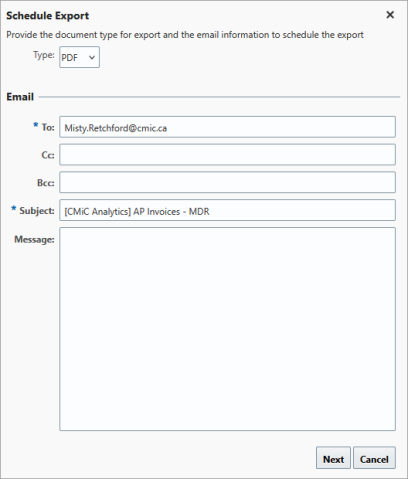
Pop-up window launched from the Schedule Export icon
In the Schedule Export pop-up window, choose either PDF or Excel for the report format. Then enter the email information and press [Next].
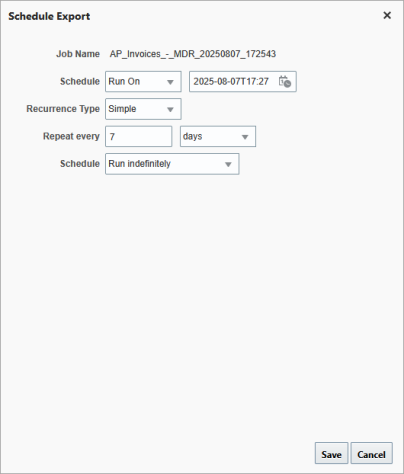
In the next window, use the Schedule field to determine when to run the report. Reporting can be scheduled to run immediately by selecting "Run Now" or at a specified time by selecting "Run On" from the Schedule field's drop-down. Reports can be configured for one-time delivery or set to run on a recurring schedule, with complete control over the date, time, and frequency of distribution.
All scheduled reports are tracked in the Scheduler Log screen in the System Data module, where users can review, verify, and manage upcoming report executions. This centralized view offers transparency and control over all automated deliveries. For users who also have the SDSLDELJOB privilege, the Scheduler Log goes a step further by allowing deletion of scheduled jobs directly from the interface. For details on using this log, refer to System Data - Scheduler Log.
NOTE: For convenience, the Scheduler Log screen can be accessed from the Utilities menu in BI Query Builder. For details, refer to BI Query Builder - Screen.

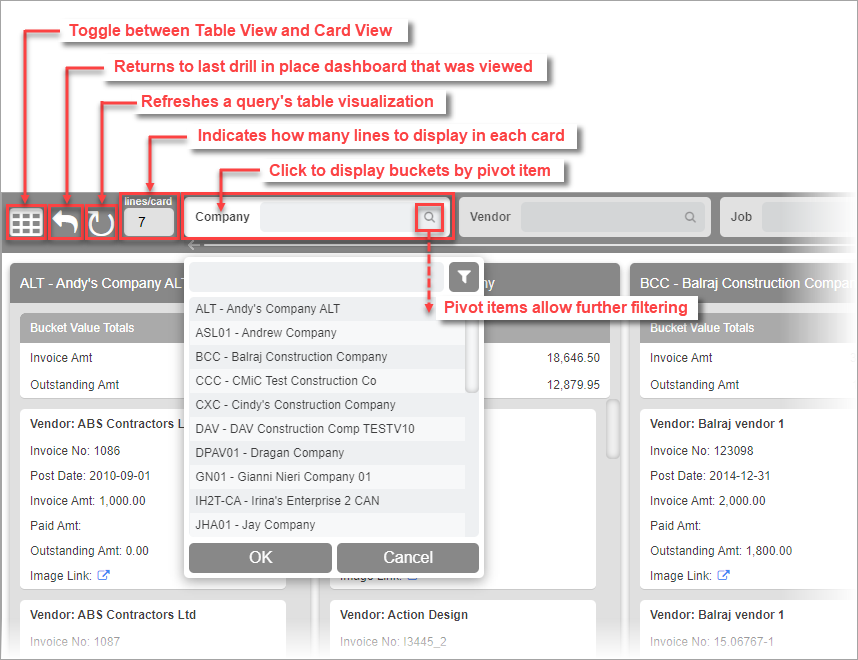
The Card View icon ( ) is available to launch a query in card view. (This icon is not visible for IE version 11 or lower.)
From card view, the Table View icon ( ) can be used to toggle back to table view.
The Back icon ( ) and the Refresh icon (
 ) are also available in card view. These two icons function the same way as on the table but for card view. Drilldown to a card view will show the Back icon to allow the user to see the last drill-in-place dashboard that was viewed. The Refresh icon is used to refresh a card view the current data from the database.

Within the Card View screen, the user can specify how many lines to appear in each card. Each card line represents a column in the query table. The order of the lines from top to bottom correspond to the order of the columns from left to right in the table.
In addition, each pivot item along the top of the screen allows filtering. Clicking on a pivot item in card view allows the user to display buckets by pivot item. If the user would like to add new pivot items, they must add the pivot items in table view and then they will be displayed in card view as well.
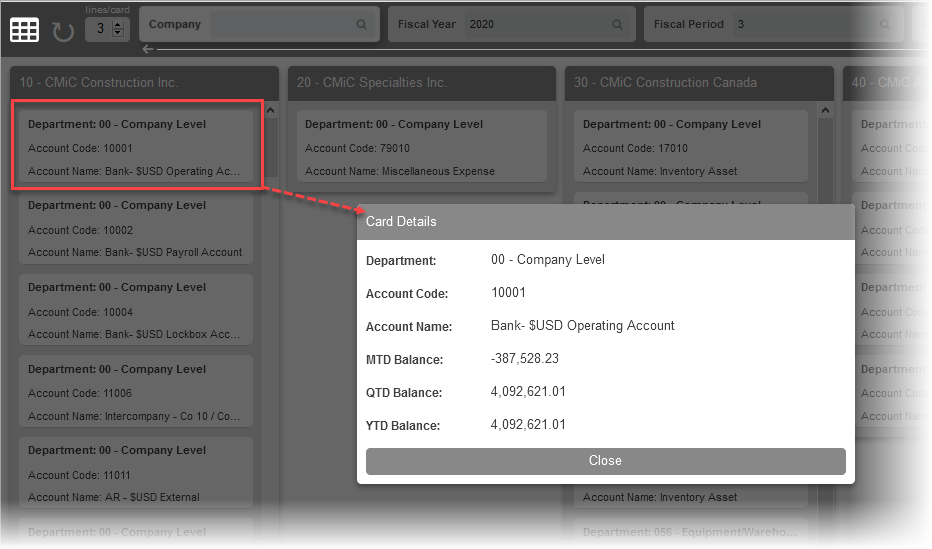
Clicking on a card launches the Card Details pop-up window, which contains additional details contained within the card.
Cards can be dragged and dropped if all conditions below are met:
-
All aggregatable columns’ aggregation must be set to “None”.
-
The selected pivot item's field is updatable. This is specified in BI Catalog Builder.
-
The primary key values must be unique for each row on the table in Table View.
-
The table column card view setting 'Read-only' is not checked.
In BI Catalog Builder, a User Defined Field (UDF) can be specified as updatable by the user. For a non-UDF field, only CMiC can make it updatable.

The Crosstab View icon is used to launch the query in crosstab view. For details about using this functionality, refer to Crosstab.

The Shift Column Control icons are used as an alternative to a horizontal scrollbar. These icons are a helpful feature in situations where there is no horizontal scrollbar (e.g., viewing a table visualization using an iOS browser).

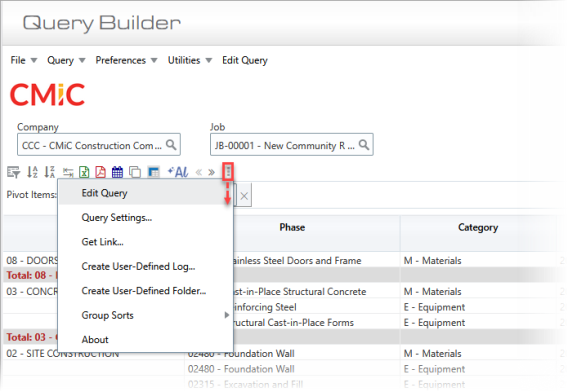
An Ellipses icon is available to open a drop-down menu containing additional query options. The options contained in this menu are described below.
When a query is launched via URL, this option will allow users to open this query in BI Query Builder if they have the appropriate system privilege (BIDBRDEDIT) assigned. BI Query Builder will be launched in a separate tab and this query will be automatically opened for editing.

The Query Settings pop-up window launched from this menu option contains the ‘Current Project Only’ checkbox. If this box is checked, and the query’s table visualization is using folders that are current-project sensitive, the table will only use data from the user’s current default project, as set in CMiC Field.
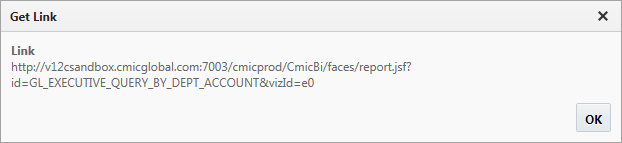
The Get Link pop-up window launched from this menu option displays the URL for the query, which can be right-clicked and copied using the context menu that appears.
This option allows you to replace a table visualization with a copy/reference table visualization from another query. Users can create a table visualization in one query and place it in other queries as a copy or reference visualization. A visualization can be copied/referenced multiple times.
If checked, this menu option allows the user to select table cell text when drill-in-place is enabled.
This feature is used to create a user-defined log in CMiC Field based on a table visualization.
For more information, refer to Create User-Defined Log based on Table.
This feature is used to create a user-defined folder in the dashboard’s data source based on a table visualization/BI query table.
For more information, refer to Create User-Defined Folder Based on Table.
This option contains two sub-options:
-
Remove Group Sorts (Keep Subtotals): This option is used to remove all Group Sorts set up for the table but to keep Subtotals for Group Sorts.
-
Remove All Group Sorts: This option is used to remove all Group Sorts (including Subtotals for Group Sorts) set up for the table.
The Group Sort option for tables is discussed in more detail in Part 1: Plotting Fields.
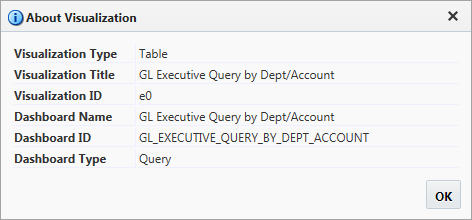
The pop-up window launched from this menu option provides additional details about the selected visualization.
Runtime Toolbar - Controls
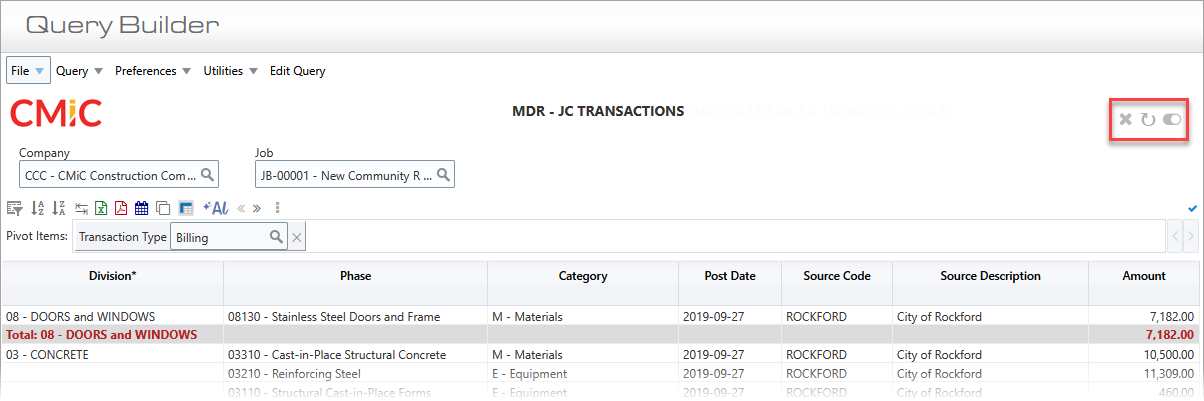
Example of query at runtime for end-users, with the Query Runtime Controls framed in red
The following query controls are applicable to end-users at runtime.
This control is used to clear all filters with a single click. When any filter on a query or dashboard has values applied, the Clear Filters icon ( ) will appear in the Runtime toolbar. To reset all filters, simply click the icon. This will instantly delete all applied filters and reset them to blank, giving you a clean slate to customize your filters again as needed. It’s particularly helpful for users who frequently adjust filters or need to reset dashboards quickly for new analyses.

This control is used to refresh a query’s table visualization using current data from the database.
Feature Note: This control was moved from Toolbar - Controls to Runtime Toolbar - Controls.

This control is for users who do not have access to Query/Dashboard Builder and are experiencing timeouts. It allows them to turn Autoload Data off, then edit their filter selections without opening Query/Dashboard Builder.
NOTE: The Autoload Data toggle must be enabled before exporting a dashboard or query to Excel, otherwise data may not be exported properly.