Overview
CMiC Analytics
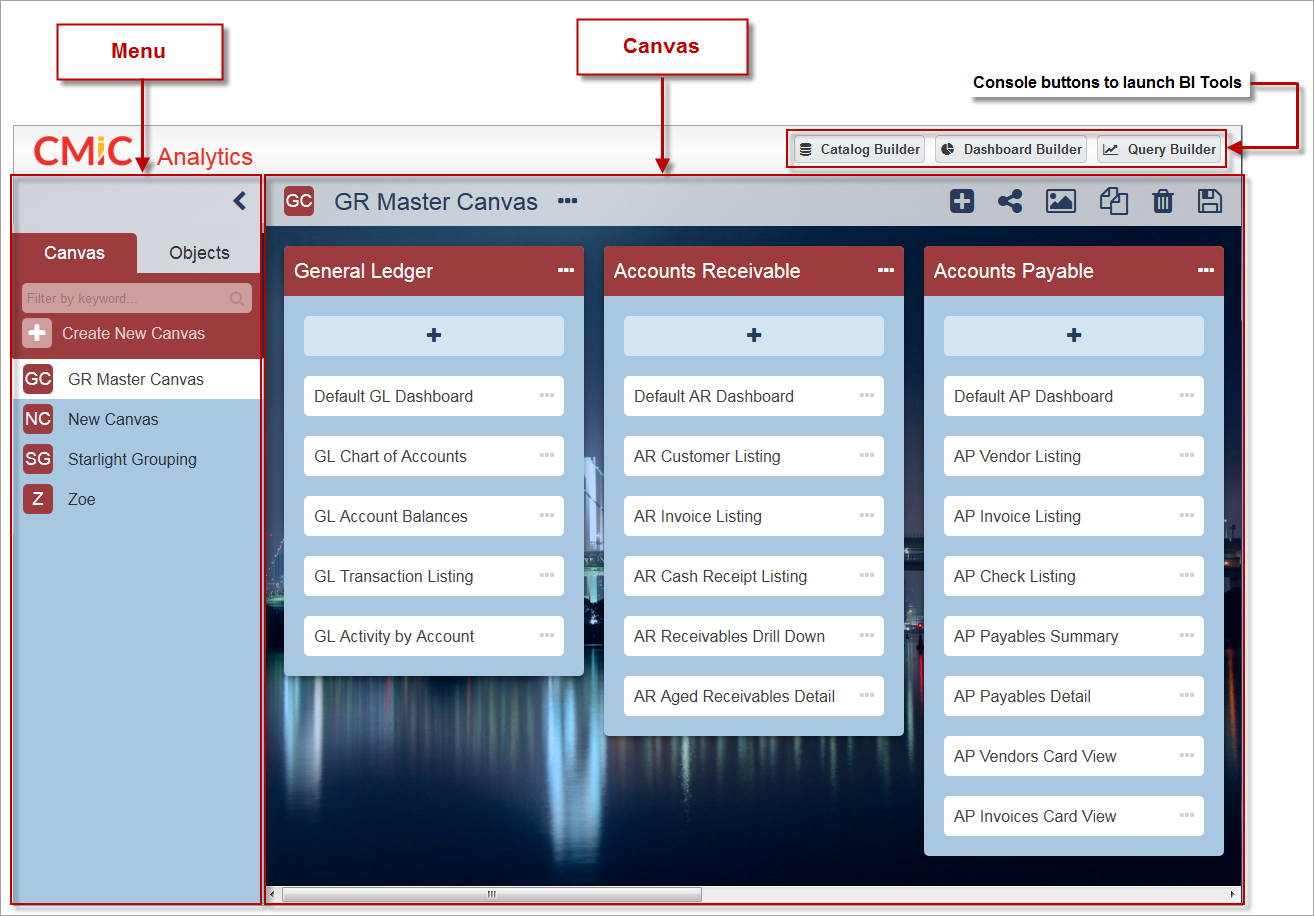
The main console contains buttons to conveniently launch BI tools directly from the BI Analytics tool. These BI tools include BI Catalog Builder, BI Dashboard Builder, and BI Query Builder.
The Analytics screen is divided into two panels: Menu and Canvas, as shown in the screenshot above.
Menu
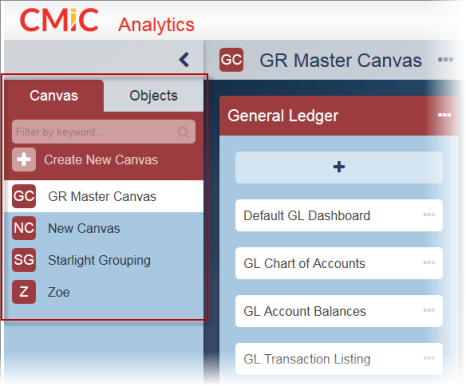
BI Analytics Menu
The Analytics menu contains two tabs: Canvas and Objects.
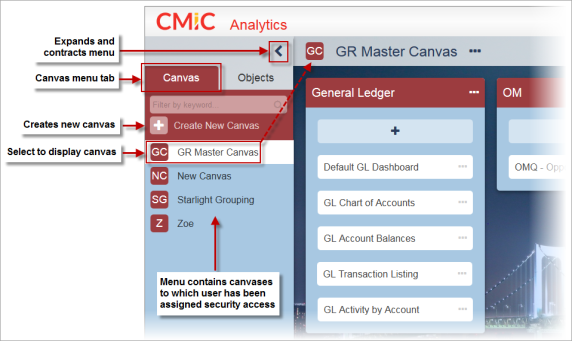
Menu - Canvas tab
The Canvas tab is used to create a new canvas or to display an existing canvas. Only canvases to which the user has been assigned security access will be displayed. The minimum security access required for a canvas to be listed in the menu is read-only, but to create a canvas a user must have the system privilege ‘BIBOARDCRT – CMIC BI: Allows the user to create BI Canvas’ as well as security role(s) that can update and delete canvases.
NOTE: If a user does not have the BIBOARDCRT system privilege, they will not see the Create New Canvas icon ( ) in the Canvas tab, or the Duplicate icon (
 ) in the canvas toolbar. Refer to System Privilege - BIBOARDCRT for more information.
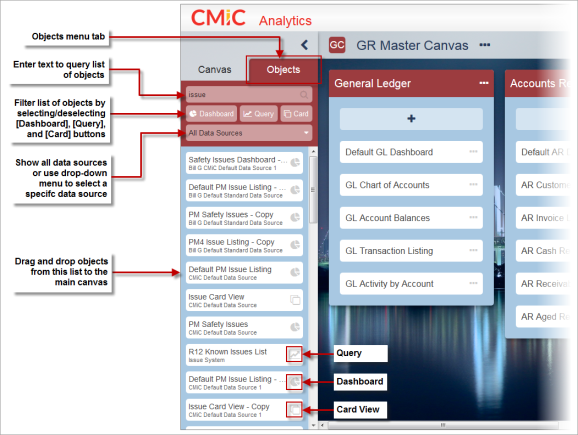
Menu - Objects tab
The Objects tab is used to display a list of dashboards, queries, and card views that can either be launched and viewed in the main canvas area or dragged and dropped into buckets in user-defined canvases.
As shown in the screenshot below, the list of objects can be filtered in several ways:
-
Search box: Use to perform a text-based query on the list of objects.
-
[Dashboard], [Query], [Card] buttons: Select/deselect these buttons to include/exclude dashboards, queries, or cards views in the list of objects.
-
Data source drop-down menu: Used to show all data sources or to select a specific data source using the drop-down menu.
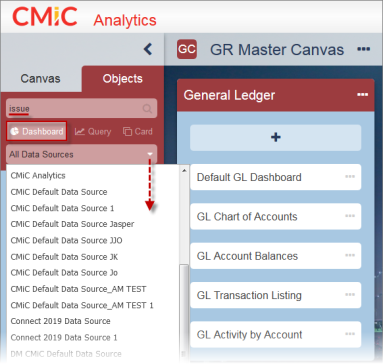
Filtering the list of objects in the Objects tab
The following screenshot shows an example of launching a dashboard from the list of objects to display it in the main canvas area. To close the dashboard and return to the canvas, click on the dashboard’s Close icon ( ).
).
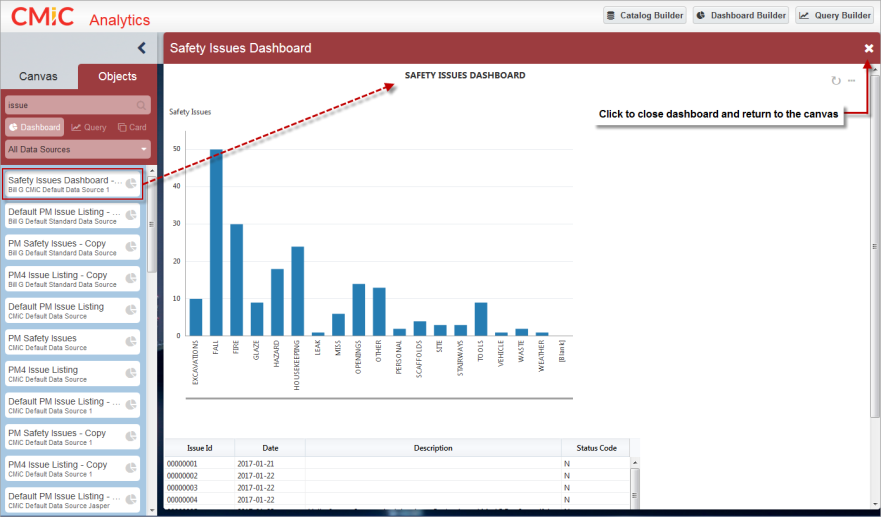
Dashboard launched from the BI Analytics menu into the canvas
Menu objects can also be dragged and dropped into a bucket on the canvas, as shown in the screenshot below.
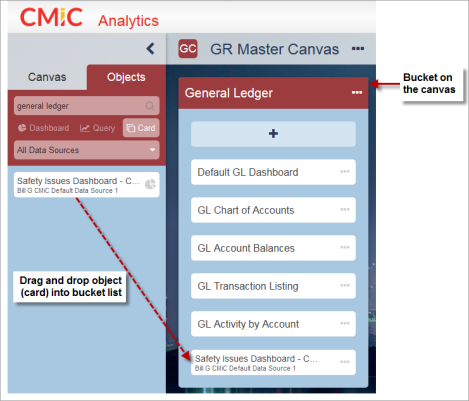
Dragging and dropping an object (card) from the BI Analytics menu to a bucket on the canvas
Canvas
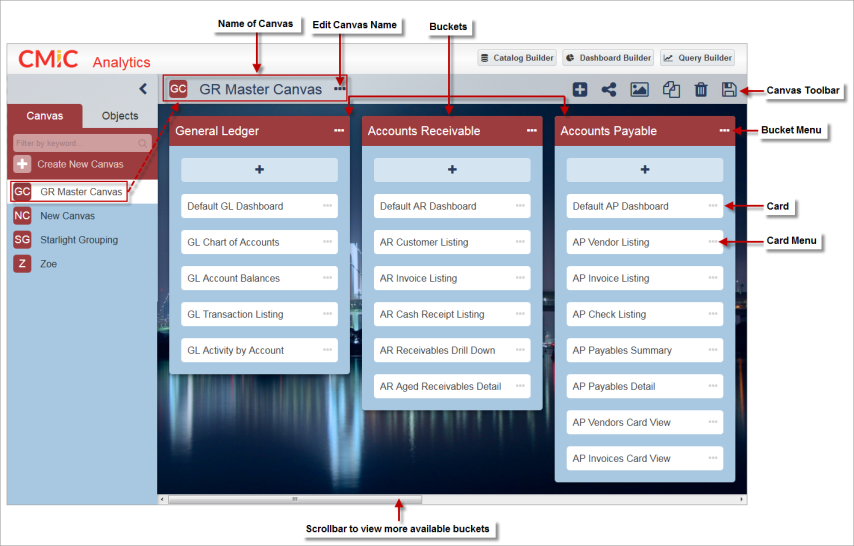
BI Analytics canvas
The Analytics canvas is used to create and organize buckets of related objects, such as dashboards, queries, and card views, making it easier to review project analytics.
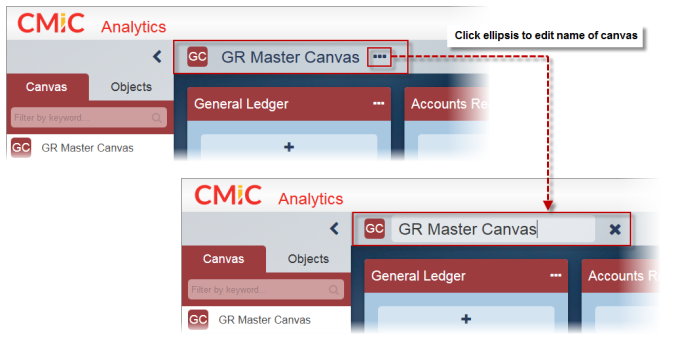
The Ellipsis icon ( ) located beside the canvas’ name allows the user to edit the name of the selected canvas.
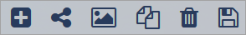
The canvas toolbar provides tools to complete the following processes on the canvas:
-
The Add Bucket icon (
 ) allows the user to create a new bucket for the selected canvas.
 -
The Canvas Access icon (
 ) allows the user to select which security roles have access to the selected canvas.
 -
The Change Canvas Background icon (
 ) allows the user to choose a background image for the selected canvas from a list of available images, or to upload their own background image.
 -
The Duplicate icon (
 ) allows the user to create a duplicate copy of a canvas.
 -
The Delete icon (
 ) allows the user to delete the selected canvas.
 -
The Save icon (
 ) allows the user to save any changes to the selected canvas.
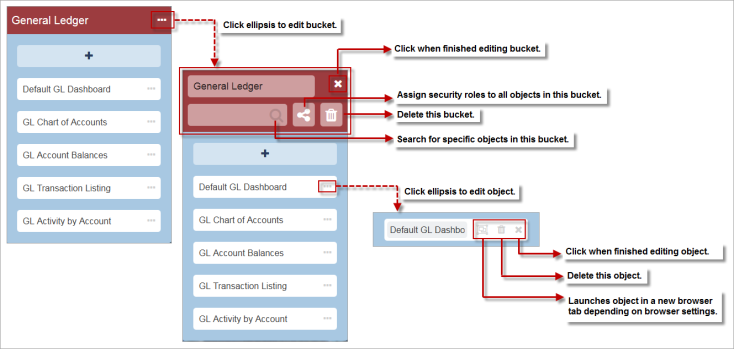
The bucket contains cards that the user has dragged and dropped from the list of objects in the Objects tab of the BI Analytics menu. The Ellipsis icon ( ) beside the bucket’s name is used to edit the selected bucket. The user can search for specific objects within the bucket, assign security roles to all the objects in the bucket, and delete objects in the bucket.
Within specific objects, clicking on the object’s Ellipses icon ( ) allows the user to launch the object or to delete the object.