Disclaimers
-
The details in this
-
CMiC Debugger is a development tool that should be used when regular troubleshooting techniques do not provide sufficient details for developers to determine the root-cause of a problem.
-
CMiC Debugger is to be used for slowness/performance type of issues. It is not meant to capture logical issues, e.g. the program behaves differently than expected or there are calculation type issues.
-
It is normal that programs run slower in the debug mode. The CMiC Debugger tool will cause some resource utilization overhead when running.
-
Information captured by the CMiC Debugger may be sensitive in nature and should be only provided to CMiC for investigation. CMiC strongly discourages sharing this information elsewhere.
-
The Debugger can only be used for UIRuntime programs (ADF) and does not support JSPs.
Prerequisites
The 'UIDETDEBUG - Allows to Run Detailed Debugging' system privilege needs to be granted to the user in the User Maintenance screen.
Process
Using the Debugger in Console
While in the UI Console, add "?debug=finest" after the console.jspx in the URL. For example, http://qa2v12.cmic.ca:8888/cmicprodR12/UIConsole/faces/console.jspx?debug=finest.
You can tell you are in Debugging mode by seeing the Debugging label after the last tab in the UI Console.
Navigate through the CMiC Enterprise Console and open the desired program and perform any desired actions to retrieve the Debugging log.
Once the debug is available for the desired process, the user can simply highlight the text (users cannot use the Select All command) and copy and paste the information into a TXT file to attach to the case.
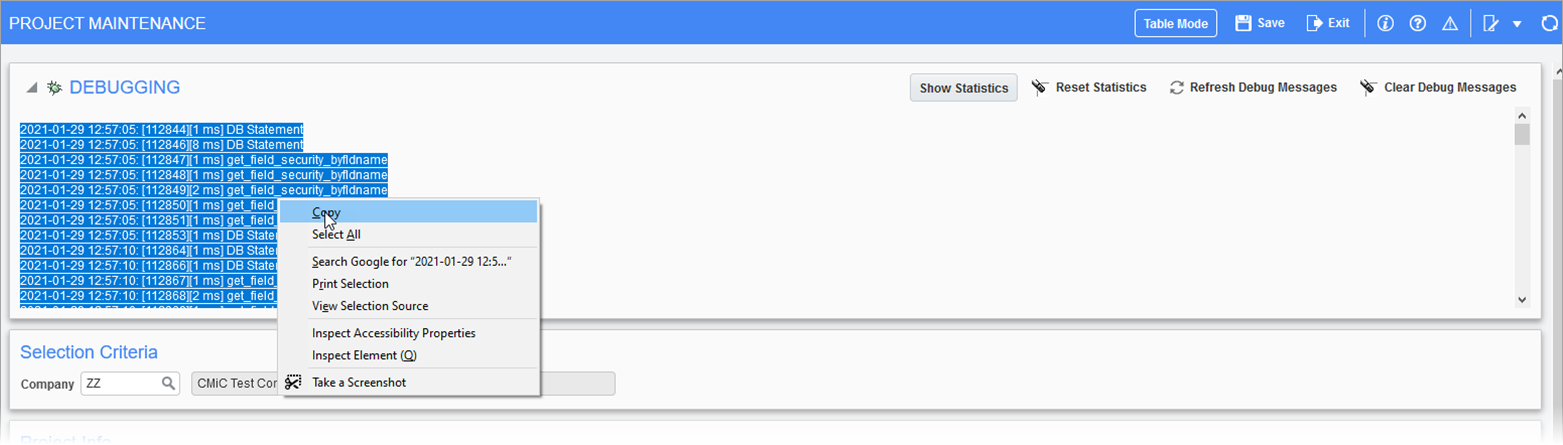
Use the [Show Statistics] button and include that in the text file too.
![Screenshot of the [Show Statistics] button](../../../Resources/Images/System_Administration_Guide_for_R12/Debugger3.png)
Always attach a video recording of the CMiC Debugger session and the corresponding output/stats file together. This will be useful for developers to see how each step corresponds to the output of the CMiC Debugger.
In cases with multiple steps, please split the debug messages by adding a header in the text file to indicate individual actions and use the [Clear Debug Messages] button between each action. Always include statistics.
For example, add the following headers in the text file:
-
Loading the Program
-
Selecting a Company
-
Entering a Record
-
Saving