(Classic)
Pgm: SYSQRTZHIS – Scheduler Log; standard Treeview path: System Data > Utilities > Scheduler Log
The Scheduler Log
The default frequency for this process is set to run hourly. This can be changed by System Administrators/Database Administrators using a script provided by CMiC to set the frequency to run as low as 5 minutes to a maximum of 60 minutes as required.
NOTE: For details on the updated version of this screen, which includes a scheduled job deletion feature when the BI scheduler is selected, refer to System Data - Scheduler Log.
Selection Criteria
Scheduler Name
Enter/select the scheduler to be reviewed.
Job Group
Enter/select the job group for the selected scheduler.
[Refresh] - Button
This button is used to refresh the data displayed in the tabs.
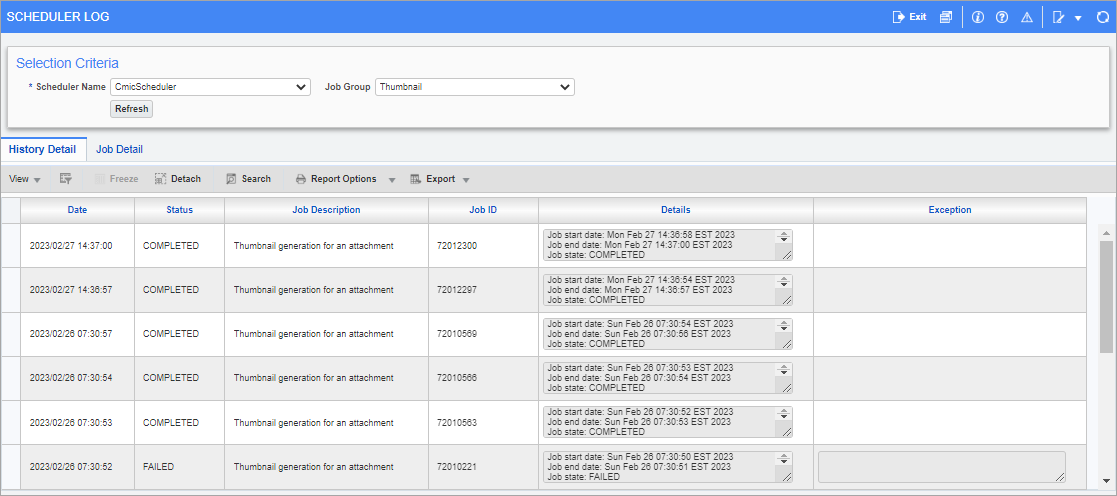
History Detail - Tab
The History Detail tab is used to review the history details of each scheduled run with date, status, start/end time stamp, and exceptions if any, as shown in the screenshot above.
Job Detail - Tab
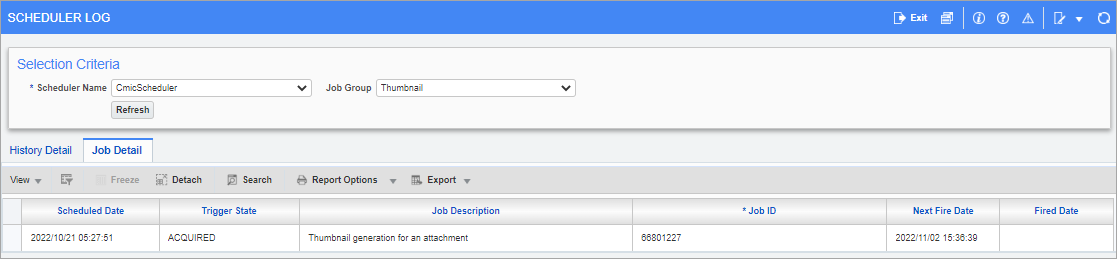
Pgm: SYSQRTZHIS – Scheduler Log; standard Treeview path: System Data > Utilities > Scheduler Log - Job Detail tab
The Job Detail tab is used to review the list of jobs in queue. The read-only details are provided in the following fields.
Scheduled Date
Indicates the date and time when the job was queued.
Trigger State
Indicates the current status of the job.
WAITING – Waiting to run.
EXECUTING – Currently running (Fired date would have a value when started).
COMPLETE – Job completed running successfully.
ERROR – Failed to run the job.
BLOCKED – Job cannot run as it be being blocked by another job in progress.
PAUSED – Job has been paused from being run.
ACQUIRED – Job may run or be placed back to wait for next cycle.
Job Description, Job ID
Provides description and ID for the job being queued.
Next Fire Date
Indicates the anticipated date and time when the job could run.
Fired Date
Indicates the date and time when the job started to run.