Pgm: OMSALFORG – Sales Forecast Report Grouped; standard Treeview path: Opportunity Management > Reports > Sales Forecast Report Grouped
This report is similar to the Sales Forecast Report, except that it contains totals for each market sector. It can be run for a consolidation group or a single company, for a calendar year. The report will display the stored sales plan information as well as the specific project information for opportunities that have been recorded against the same market sector classifications. Also, only opportunities with the ‘Include In Forecast’ checkbox (found on the main section of Opportunities screen) set to true will be included in this report.
NOTE: In order for the report to run with values, the Market Sector and Year fields for an opportunity need to be populated in the OM Opportunity Management - Sales Plan screen.
NOTE: Only opportunities with the ‘Include In Forecast’ checkbox set to true will be included in this report. On the Opportunities screen, this checkbox is found under its main section (Opportunity Management).
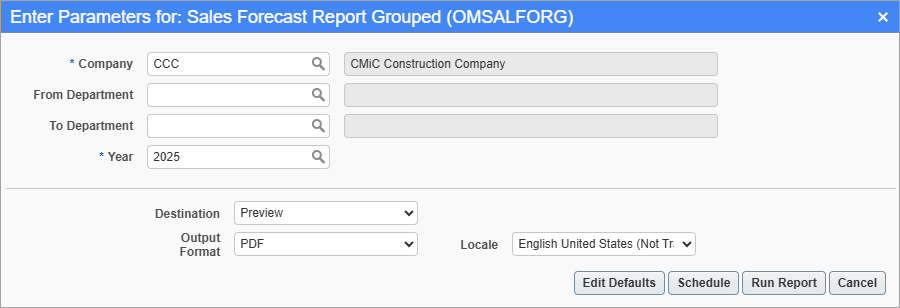
Company
Company handling projects associated to opportunities.
From Department
Optional; if left blank, taken to be first department, by code. Specifies which department to start with, by department code.
To Department
Optional; if left blank, taken to be last department, by code. Specifies which department to end with, by department code.
Year
Year projects associated to opportunities.
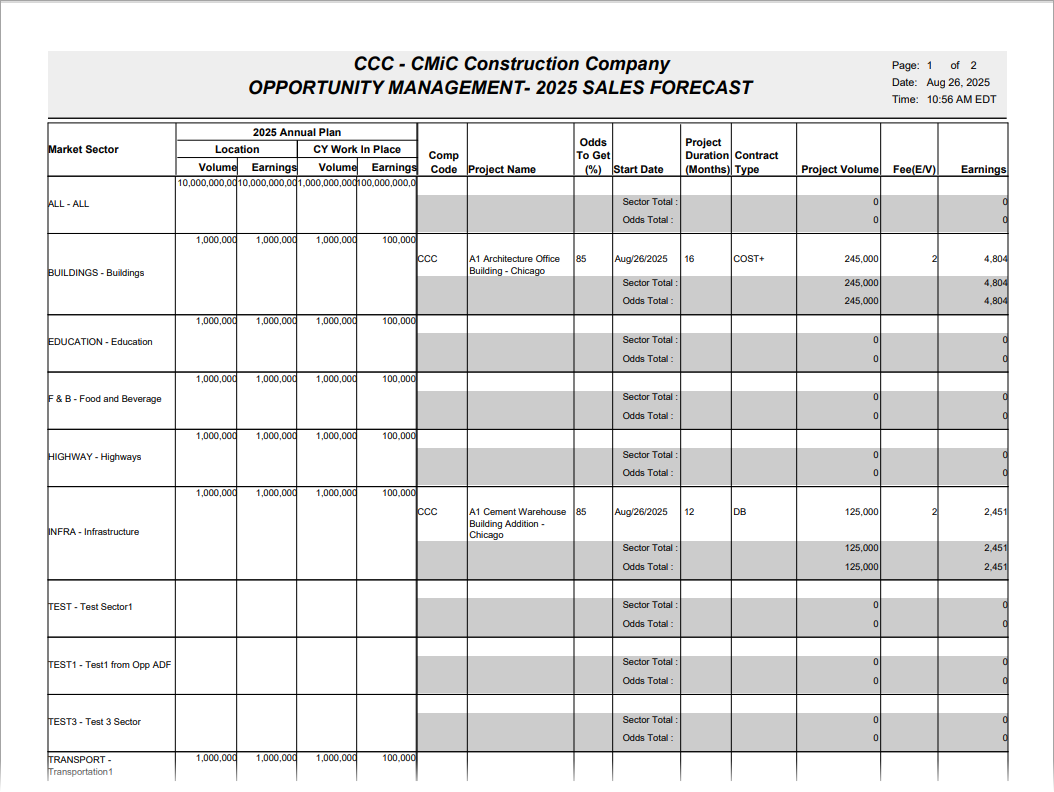
Sample Sales Forecast Report Grouped (OMSALFORG)
The left side of the report details the sales plan information and includes the following information:
Location Volume
Shows the gross sales volume, as entered in the sales plan for the year and market sector.
Location Earnings
Shows gross sales earnings, as entered in the sales plan for the year and specific market sector.
CY Sales Volume
Current year sales volume as entered in the sales plan for the year and market sector.
CY Sales Earnings
Current year sales earnings as entered in the sales plan for the year and market sector.
The right side of the report is based on the entered opportunities, matched to the specified market sectors, and includes only opportunities that have been specified to be included in the sales forecast report. All values are retrieved from the Opportunity screen and the calculated values include:
Fee (E/V)
This is calculated as the Earnings Amount ÷ Project Volume × 100.
Earnings
This amount represents the Fee Percentage × Volume Amount ÷ 100 and is meant to display the fee minus the non-reimbursable fee.
NOTE: There are two possible company options for fee calculations. As such, if using a consolidation code which includes won opportunities using fee as calculated on cost vs. calculated on contract, two identically entered opportunities may show different fee amounts.