Why is it Useful?
This update significantly improves the usability of exported queries and crosstabs by adding page filters, substitution variables, and pivot items to the header of the Excel spreadsheet. Having this contextual information directly within the export ensures that users immediately understand the scope and criteria of the data they’re analyzing. Previously, without this information, it could be challenging to determine the applied filters or configuration, leading to potential confusion or misinterpretation. By providing clarity and context at a glance, this enhancement streamlines workflows and reduces the need for additional cross-referencing.
NOTE: This feature is being released in Patch 21 (BI-892).
How Does it Work?
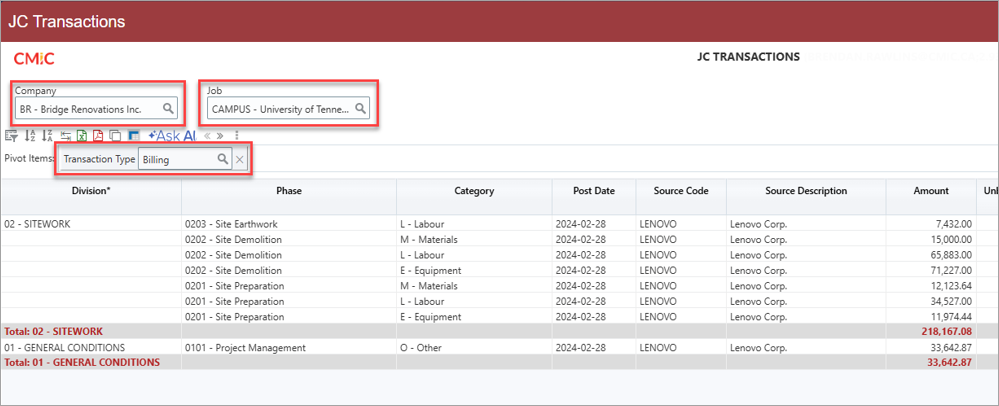
Page filters, substitution variables, and pivot items in query
Start by populating the page filters or substitution variables to suit your specific needs. Once you’ve configured the query or crosstab, click the Excel icon located at the top left of the visualization to export the data.
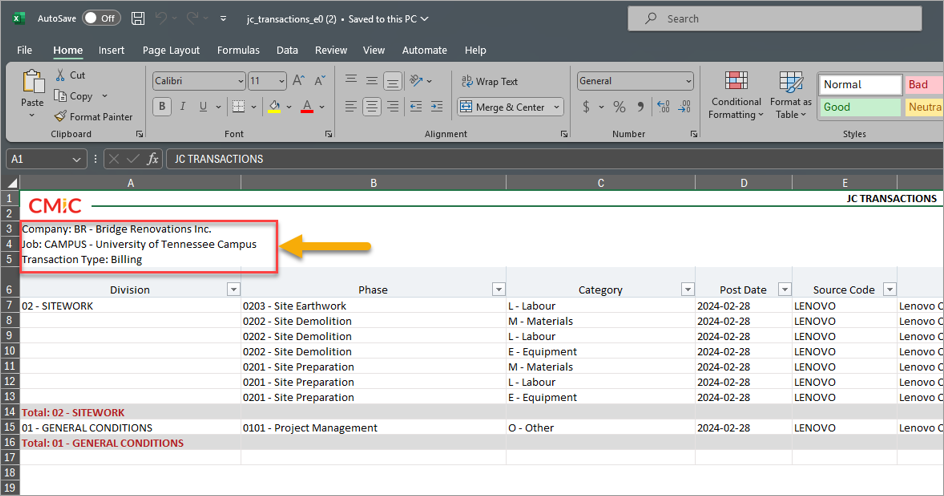
Exported Excel spreadsheet with page filters, substitution variables, and pivot items displayed in the header section
In the exported Excel spreadsheet, the page filters, substitution variables, and pivot items will automatically appear in the header section, just below the logo. This ensures that every export includes clear context about the applied settings, making it easier to interpret and share your data accurately.
To learn more about some of the latest features released in this patch, return to Patch 21 Highlights.