Why is it Useful?
CMiC has added a Treemap visualization to the BI Dashboard Builder tool. The Treemap visualization is useful because it is more versatile than a bar chart and can show more information in less space while still being easy to read.
NOTE: This feature was released in Patch 14-2 under Issue 21.42008.
How Does it Work?
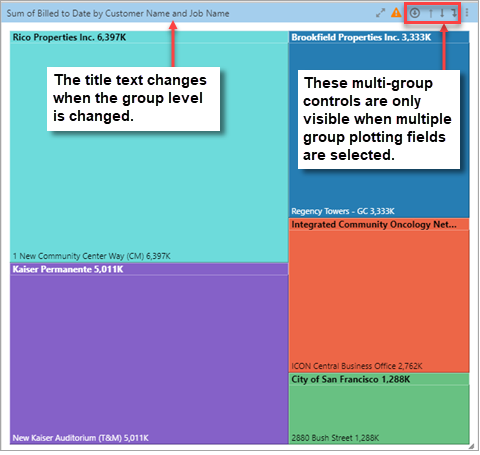
Example of Treemap Visualization in BI Dashboard Builder Tool
To learn more about how a Treemap visualization works and to see a variation called the Sunburst visualization, refer to BI Dashboard Builder - Treemap and Sunburst Visualizations.