Overview
BI Dashboard Builder can be used for building custom dashboard AP Vendor BI tables. It enables users to view real-time data directly from a user’s CMiC system. It also gives users the flexibility of creating and customizing their own dashboard by adding or removing specific fields to meet their individual requirements.
Step 1: Create New Dashboard
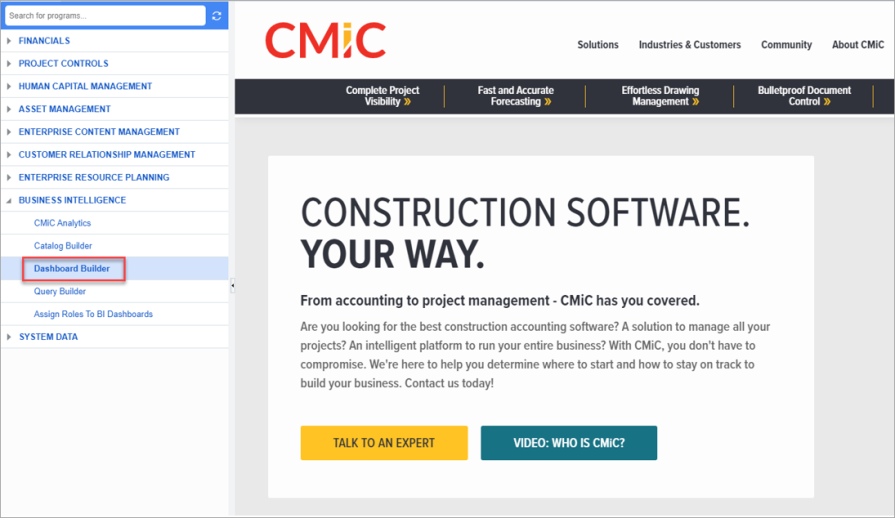
Navigate to Business Intelligence < Dashboard Builder. Dashboard Builder opens in a new tab.
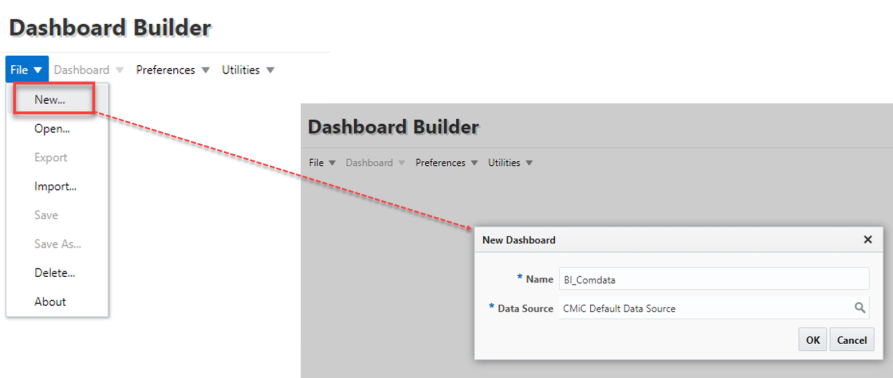
Click on File < New. Enter a name for the new dashboard and select "CMiC Default Data Source" in the Data Source field.
Step 2: Create a Table
![]()
Go to Visualizations and click on the Table icon (![]() ).
).
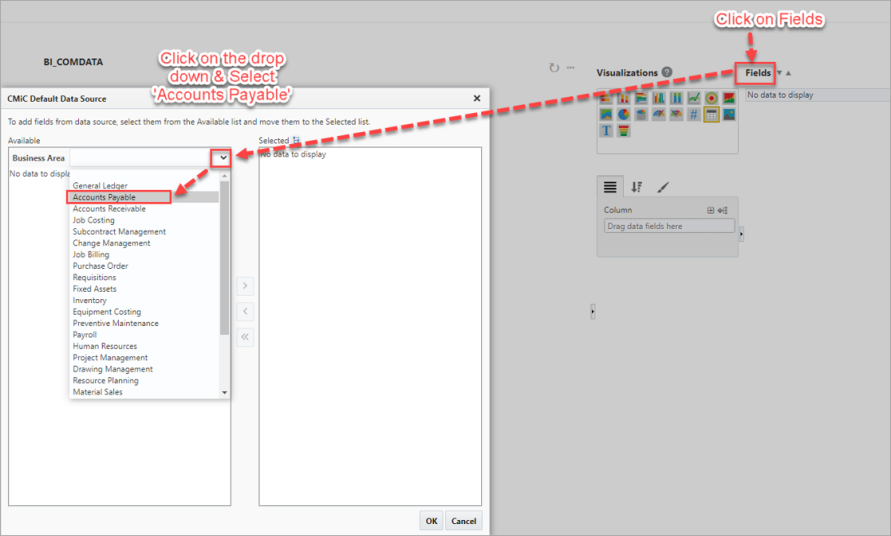
Click on Fields to open the CMiC Default Data Source pop-up window and select "Accounts Payable" in the Business Area drop-down menu.
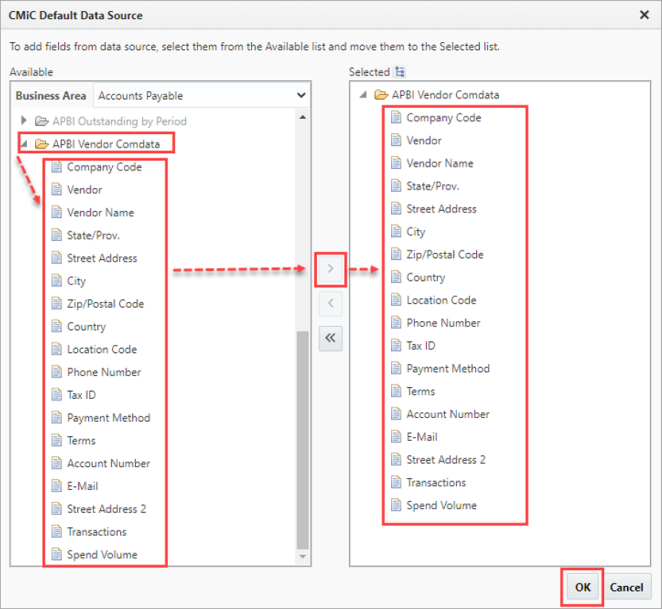
Click on the "APBI Vendor Comdata" folder. Select all the fields and click on the Add icon (![]() ) which looks like a right arrow. All the selected fields will be added in the right pane. Click on the [OK] button.
) which looks like a right arrow. All the selected fields will be added in the right pane. Click on the [OK] button.
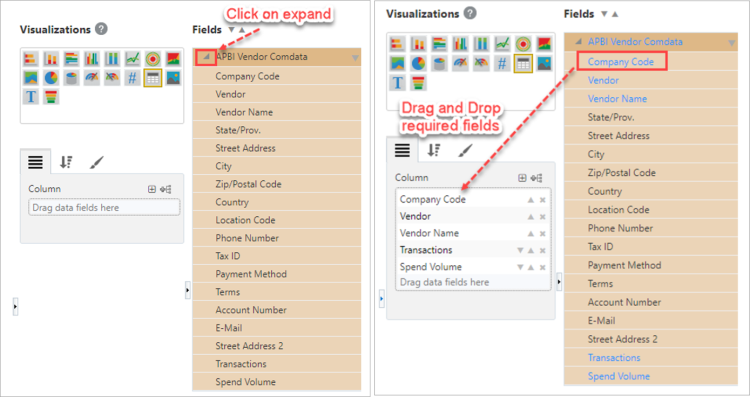
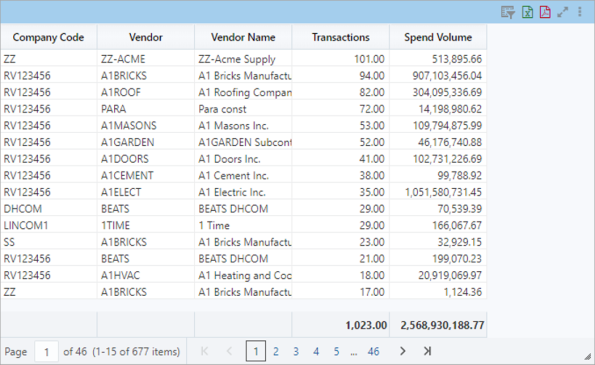
All the selected fields will be available under the Fields section. Drag and drop the required fields under the Column section. The table gets created as the fields are dropped in the Column section.
Step 3: Insert Filter in the Table
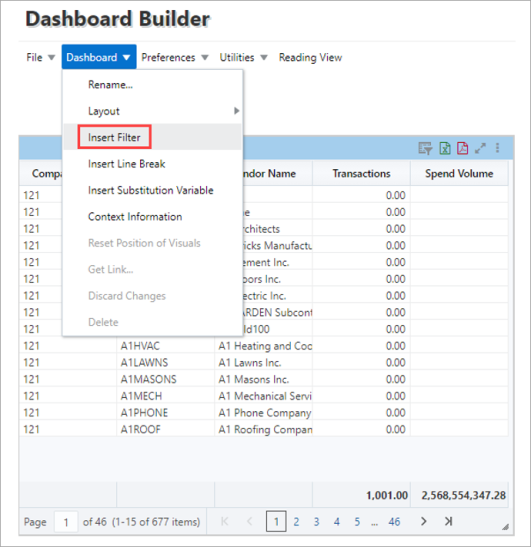
Navigate to the Dashboard menu and select "Insert Filter" from the drop-down.
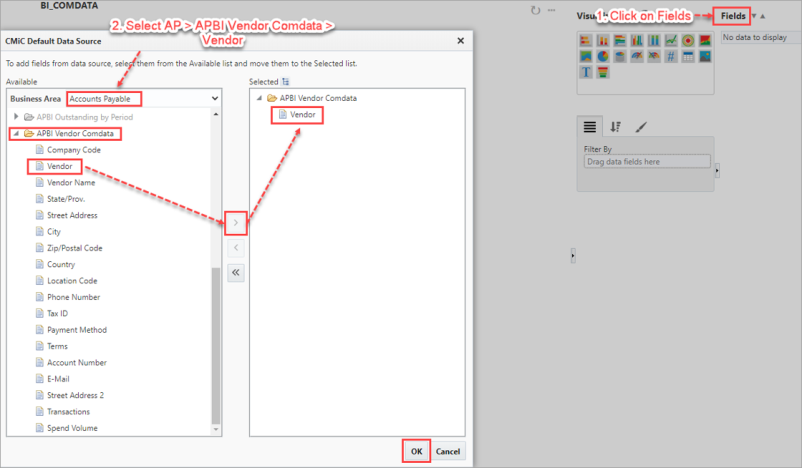
Click on Fields to open the CMiC Default Data Source pop-up window and select "Accounts Payable" in the Business Area drop-down menu. Click on the "APBI Vendor Comdata" folder. Select the required field to filter the table and click on the Add icon (![]() ). The selected field will be added in the right pane. Click on the [OK] button.
). The selected field will be added in the right pane. Click on the [OK] button.
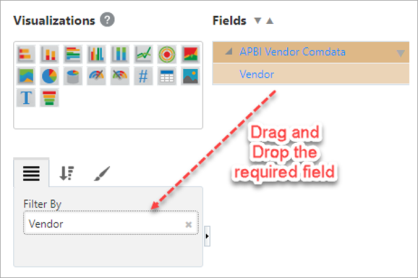
The selected fields will be available under the Fields section. Drag and drop the required fields under the Filter By section.
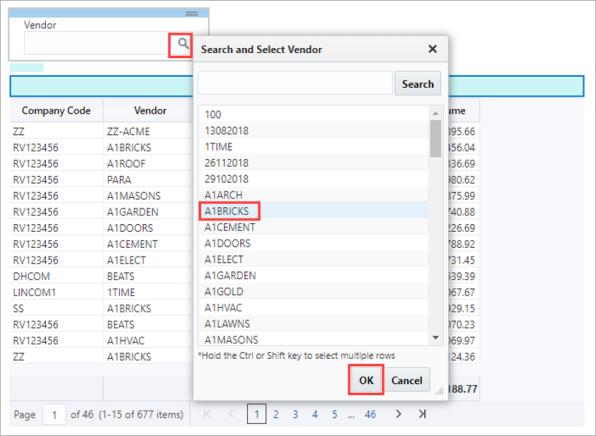
A Filter box with the selected field appears above the table. Search and select the filter accordingly.
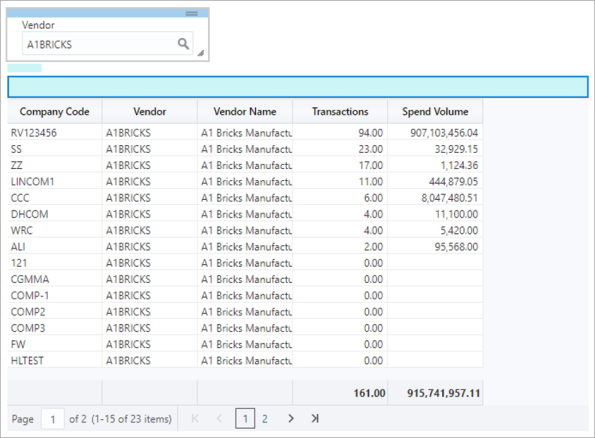
The table gets filtered. Users can sort the table fields in ascending or descending order by using the Sort Ascending or Sort Descending functionality.
Step 4: Export Table to Excel or PDF
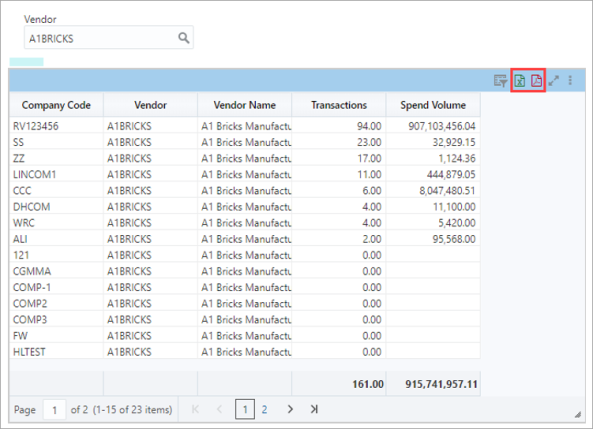
Select the table header so that it is highlighted in blue. This will enable additional table features, such as the Export to Excel and Export to PDF options in the top-right of the table's header. Click the Excel icon (![]() ) to export the table's data to an Excel spreadsheet or click on the PDF icon (
) to export the table's data to an Excel spreadsheet or click on the PDF icon (![]() ) to export the table's data to a PDF file.
) to export the table's data to a PDF file.